 J Clin Aesthet Dermatol. 2022;15(6):59-64.
by Ty Gilkey, BS; John Trinidad, MD; Claire Kovalchin, BS; Abena Minta, BS;
Misha Rosenbach, MD; and Benjamin H. Kaffenberger, MD
Mr. Gilkey, Ms. Kovalchin, and Ms. Minta are with the Medical Student Research Program at The Ohio State College of Medicine in Columbus, Ohio. Drs. Kaffenberger and Trinidad are with the Department of Internal Medicine in the Division of Dermatology at The Ohio State University Wexner Medical Center in Columbus, Ohio. Dr. Rosenbach is with the Department of Dermatology at the University of Pennsylvania in Philadelphia, Pennsylvania
FUNDING: Funding for this study was provided by The Ohio State University Medical Student Research Scholarship.
DISCLOSURES: The authors report no conflicts of interest relevant to the content of this article.
ABSTRACT: Objective. We sought to evaluate medication exposures during an entire hospitalization, with the goal of describing medications and demographic conditions that are associated with developing a drug eruption during hospitalization.
Methods. 468 patients that developed a cutaneous drug eruption were identified from a cohort of 18,140 unique inpatients with dermatologic diagnoses; medication lists and demographic information were assimilated, and drug eruption frequency tables were created.
Results. The agents most commonly associated with drug eruptions included many antineoplastic, antifungal, and antibiotic therapeutics: idarubicin (27.78% reaction rate), daunorubicin (26.43%), sorafenib (25.00%), lenalidomide (23.53%), all-trans-retinoic acid (22.58%), decitabine (21.57%), aztreonam (15.15%), posaconazole (14.29%), and voriconazole (13.78%) among many others. Patients diagnosed with drug eruptions were more likely to have private insurance (3.29% vs. 2.58% reaction rate) and were on average older (56.7 vs. 52.6 years), had longer inpatient stay (14.2 vs. 7.9 days), and higher inpatient mortality (5.95% vs. 2.58%) than patients without eruptions.
Limitations. This was a single-center cross-sectional study. Drug reaction codes were used substantially less frequently than more general codes for non-specific eruptions, further, the analysis was stratified by full hospitalization data to account for delayed reactions.
Conclusion. Hospitalizations in which patients receive medications common to malignancies, such as cytotoxic and antifungal therapies represent the highest risk hospitalizations for the development of drug eruptions. When diagnosing and treating drug eruptions, clinicians should consider these medication classes with a high index of suspicion.
Keywords: Drug eruption, DRESS Syndrome, medical dermatology
The most common dermatologic disease seen in the inpatient setting is the cutaneous drug eruption.1 In up to 94 percent of cutaneous drug eruptions, the appearance is a “morbilliform” rash.2 Penicillins, sulfa-drugs, anticonvulsants and NSAIDs are common causative agents for morbilliform eruptions.3 Traditionally, the first-line treatment for severe morbilliform drug reactions is discontinuation of the causative medication and treatment with antihistamines and topical corticosteroids; whereas more mild reactions may be monitored and observed, particularly if the suspected offending medication is essential.4 In hospitalized patients where polypharmacy is common, it can be challenging to identify the drug etiology, causing patients to be taken off of multiple medications, and prescribed unnecessary second-line medications.5 This can cause significant financial burden, as second-line medications can be up to four times as expensive as their first-line counterparts; furthermore, the removal of patient medications in a trial-and-error type of treatment can lead to additional complications due to reappearance of suppressed disease symptoms which may be a major contributing factor to the increased length of stay associated with hospitalized patients with morbilliform eruptions.5,6
Unfortunately, there is a lack of updated information on the association of drug exposures in the hospital setting with suspected drug eruptions. While there are causation-attribution tools available to physicians such as the Naranjo criteria,7 these are not optimized for hospital use. For example, re-challenges may not be feasible, and drug and metabolite levels are not typically available, leading to the inability of these criteria to predict the causative medication. In the past, there was a publicly funded collaborative surveillance program that utilized data from 15,438 patients to assist clinicians in making data-informed decisions to discontinue the most high-risk medication on their patients’ medication lists.8 However, the program ended in the 1980s and many of the drugs implicated in the study are no longer in frequent use, with hundreds of currently prescribed medications being synthesized after the completion of the surveillance program.8
This study was conducted as a modernization of the collaborative surveillance program to provide updated drug associations to assist physicians in determining and understanding drug associations with hospitalizations.
Methods
Patient database. The study utilized identified patient data under Institutional Review Board (IRB) number 2014H0351 of The Ohio State University Wexner Medical Center. The variables of interest were collected from OSU Wexner Medical Center’s Information Electronic Health Record using Information Warehouse data collection system. Each patient entry includes demographic information, body mass index (BMI), length of stay, insurance type, mortality data, comorbidity data, primary and secondary diagnoses, laboratory data, pathology data, medication lists, and readmission data.
Study population. The study population of 18,140 unique hospital visits consisted of every adult inpatient who received any dermatology related primary or secondary ICD code during any one of their hospitalizations at The Ohio State Wexner Medical Center from 2011 to 2017. The diagnosis of interest—(generalized) drug-induced dermatitis—was selected from the database using the International Classification of Diseases, Tenth revision, Clinical Modifications codes (ICD-10-CM) of L27.0 or 693.0 (ICD-9-CM) as a primary or secondary discharge diagnosis during the hospitalization. Diagnoses of Stevens-Johnson Syndrome/toxic epidermal necrolysis (SJS/TEN) as well as drug reaction with eosinophilia and systemic symptoms (DRESS) were additionally included in our search criteria. Any patient that had a diagnosis of rash and other nonspecific skin eruption (ICD-10; R21) was not included as a drug eruption patient. Income quintiles for the population (1st quintile indicating highest levels of income) were determined on a zip code level utilizing the most recent publicly available census data.9
Isolating the most-commonly received medications. JMP Pro 14 (SAS Institute, Cary, North Carolina) was utilized to quantify the frequency that every word appeared within the patient medication lists. The frequency table created by JMP was analyzed using Microsoft Excel to identify and classify medications that appeared on the table according to the United States Pharmacopeia (USP) medication classification pivot table.10 Any medication taken by greater than 0.1% of the cohort (identified as appearing ≥18 times in the frequency table) was further analyzed to determine the frequency that patients hospitalized with these medications experienced a drug eruption. Additionally, drugs were analyzed as a binary risk factor rather than as time-dependent variable to account for delayed chemotherapy eruptions, such as cytarabine, which commonly occur 10 to 20 days after the completion of therapy.11 While the notes often implicated a specific drug, we chose to analyze the drugs agnostically since other than Drug Reaction with Eosinophilia and Systemic Symptoms (DRESS) syndrome and Stevens-Johnson Syndrome, formalized clinical attribution criteria were generally not utilized. Furthermore, failure to do so would miss influences by drugs potentially reacting through immune reconstitution, delayed metabolites, or cofactors. Drugs involved in clinical trials were excluded. Drugs that were prescribed as a treatment for cutaneous drug reactions were also excluded, e.g. rapid-acting anxiolytics, antihistamines, and corticosteroids. The number of drug eruptions per 1,000 inpatient days was determined by taking the ratio of the total number of days that inpatients were hospitalized to the total number of drug eruptions for that medication. Drugs were then sorted into five groups based on the frequency of their use.
Results
Demographics. The patients included in the population were approximately equally male and female, with a mean age of 56.6. Patients from all races, insurance types, and income levels were included in the study, and the mean hospitalization length for the entire cohort was 8.1 days. There was a total of 468 documented drug eruptions in the cohort of 18140 patient-hospitalizations for an overall reaction frequency of 2.58%.
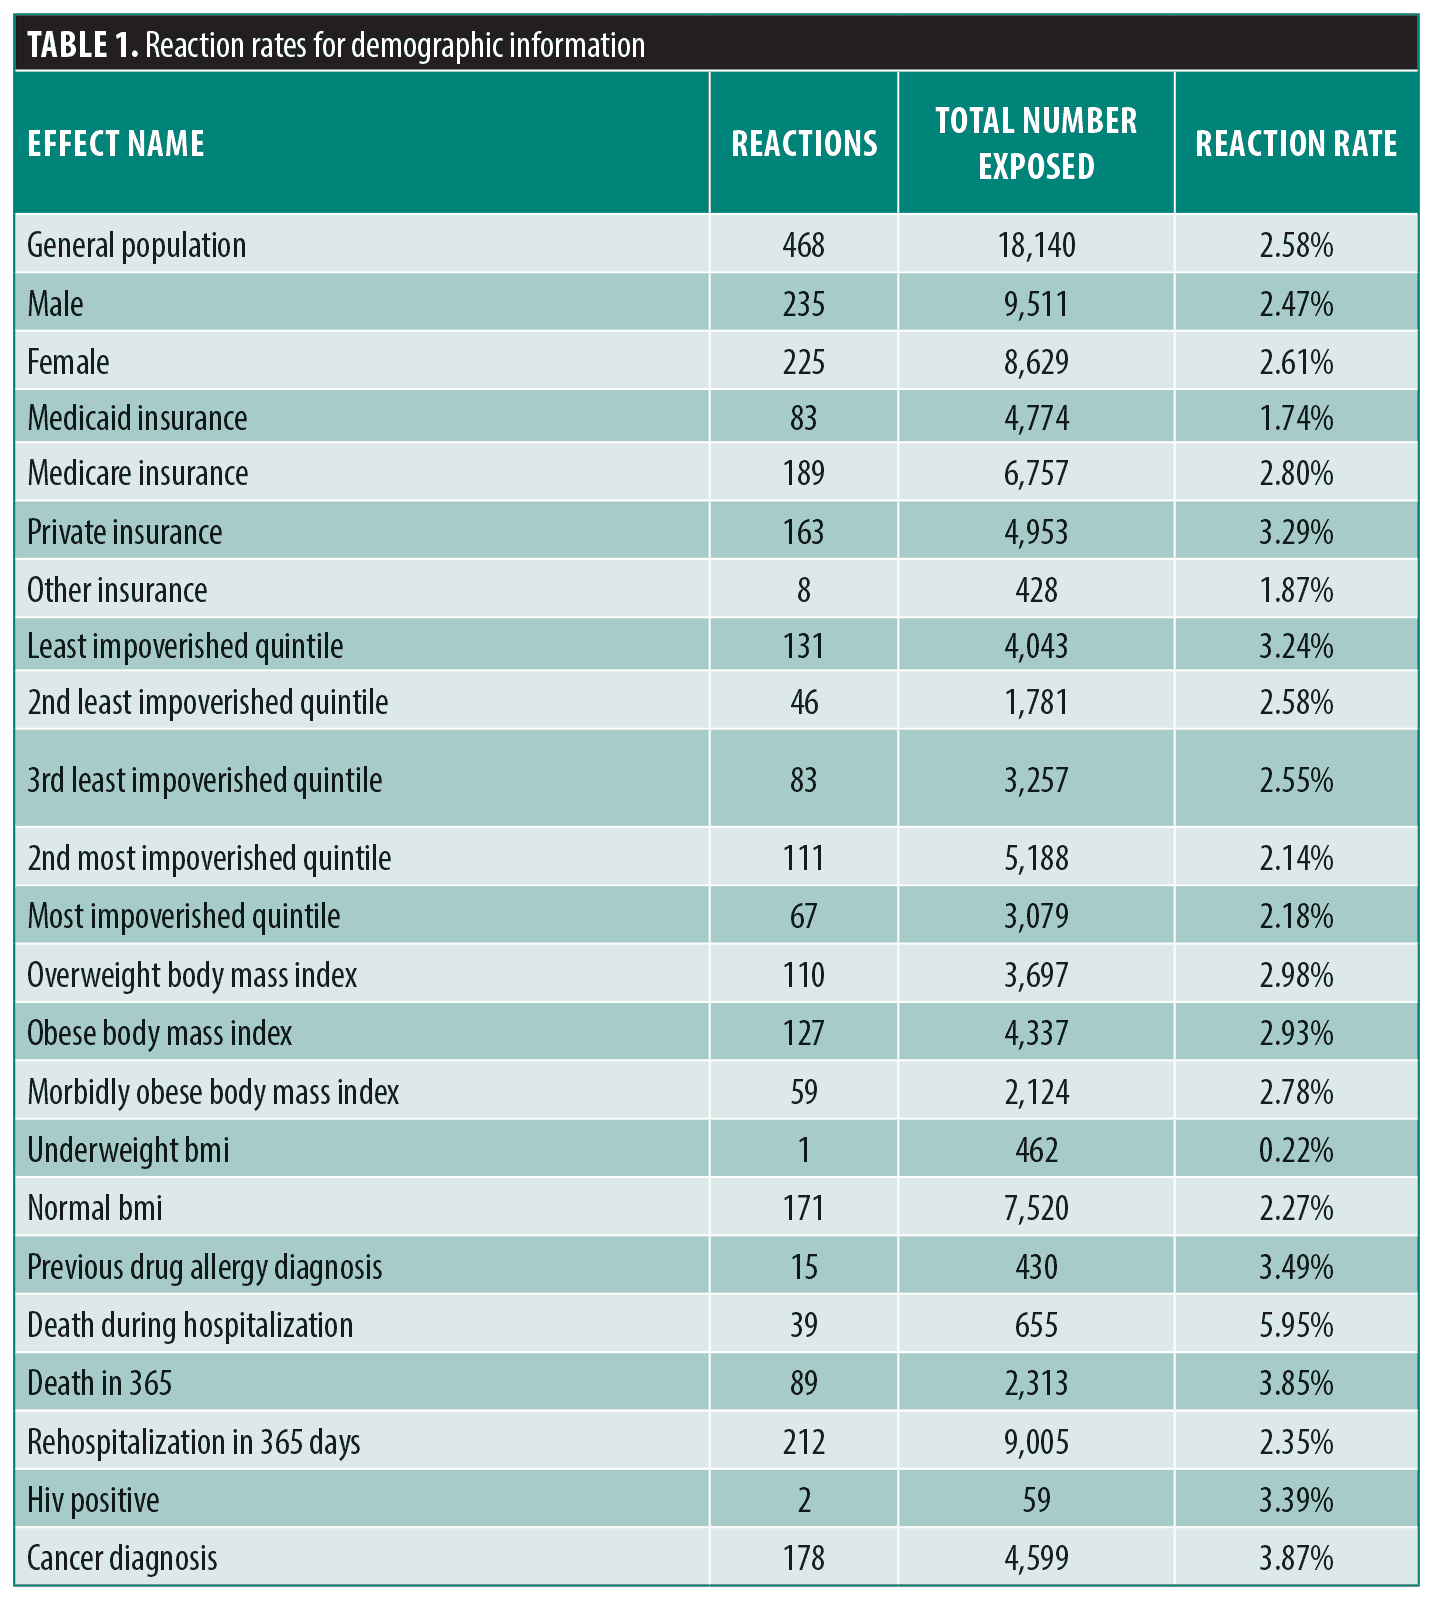
Drug rash associations by frequency. Table 1 displays demographic associations with cutaneous drug eruptions. Females (2.61%) had a higher rate of reactions than males (2.47%). The average age of patients that had a drug reaction (56.7) was greater than the age of those with no reaction (52.6), and patients who experienced a drug reaction had an average length of stay (14.2 days) almost twice as long as patients with no drug reaction (7.9 days). The average Charlson Comorbidity Index of patients who experienced a drug reaction (4.26) was slightly greater than the average Charlson Comorbidity Index of those with no reaction (3.86). Patients on private insurance (3.29%) were diagnosed with drug eruptions at almost twice the rate of patients on Medicaid (1.74%), with Medicare (2.80%) and other insurances (1.87%) falling in-between. Patients from the wealthiest quintile of zip-codes had the highest rate of drug reactions (3.24%), with reaction rate trending downward as each zip-code becomes poorer toward the most-impoverished quintile of zip codes (2.18%). Overweight (2.98%), obese (2.93%), and morbidly obese (2.78%) patients had reaction rates higher than patients of normal BMI (2.27%), and much higher than underweight patients (0.22%). Patients who were previously diagnosed with a drug allergy (3.49%) were more likely than those with no previous drug allergy (2.56%) to have a drug reaction. Patients who had a drug eruption contributed to 5.95% of the deaths during hospitalization and 3.85% of the deaths during the year following their hospitalization, which is higher than expected if they were no different than their counterparts (2.58%).

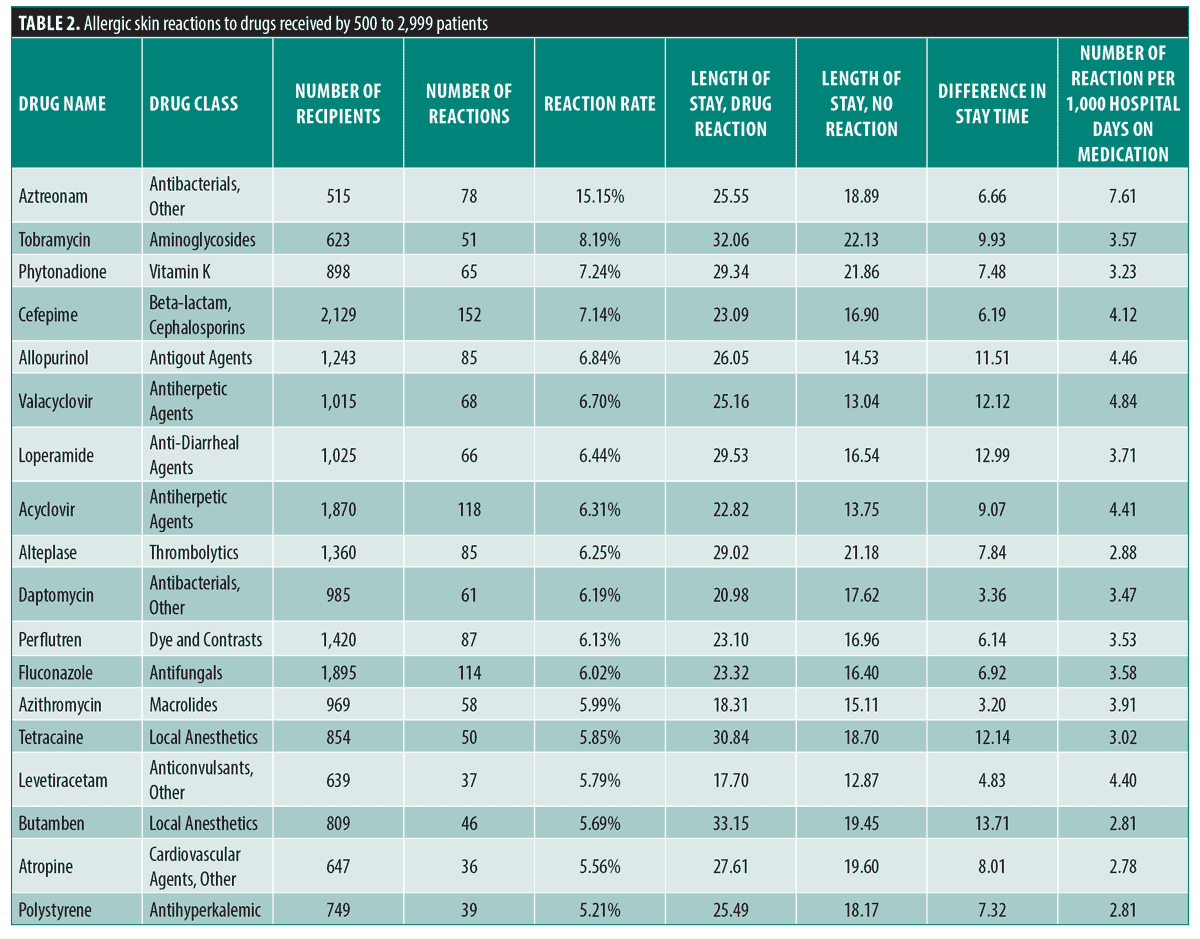
The frequency of cutaneous drug eruptions for drugs received by greater than 500 patient-hospitalizations that had greater than two times average (5.16%) reaction frequency are displayed in Table 2. Medications with reaction rates greater than 6 percent in this group include antimicrobials, contrast agents, and anti-gout drugs, for instance: aztreonam (15.15%), tobramycin (8.19%), phytonadione (7.24%), cefepime (7.14%), allopurinol (6.84%), valacyclovir (6.70%), loperamide (6.44%), acyclovir (6.31%), perflutren contrast (6.13%), daptomycin (6.19%), fluconazole (6.02%), and azithromycin (5.99%).

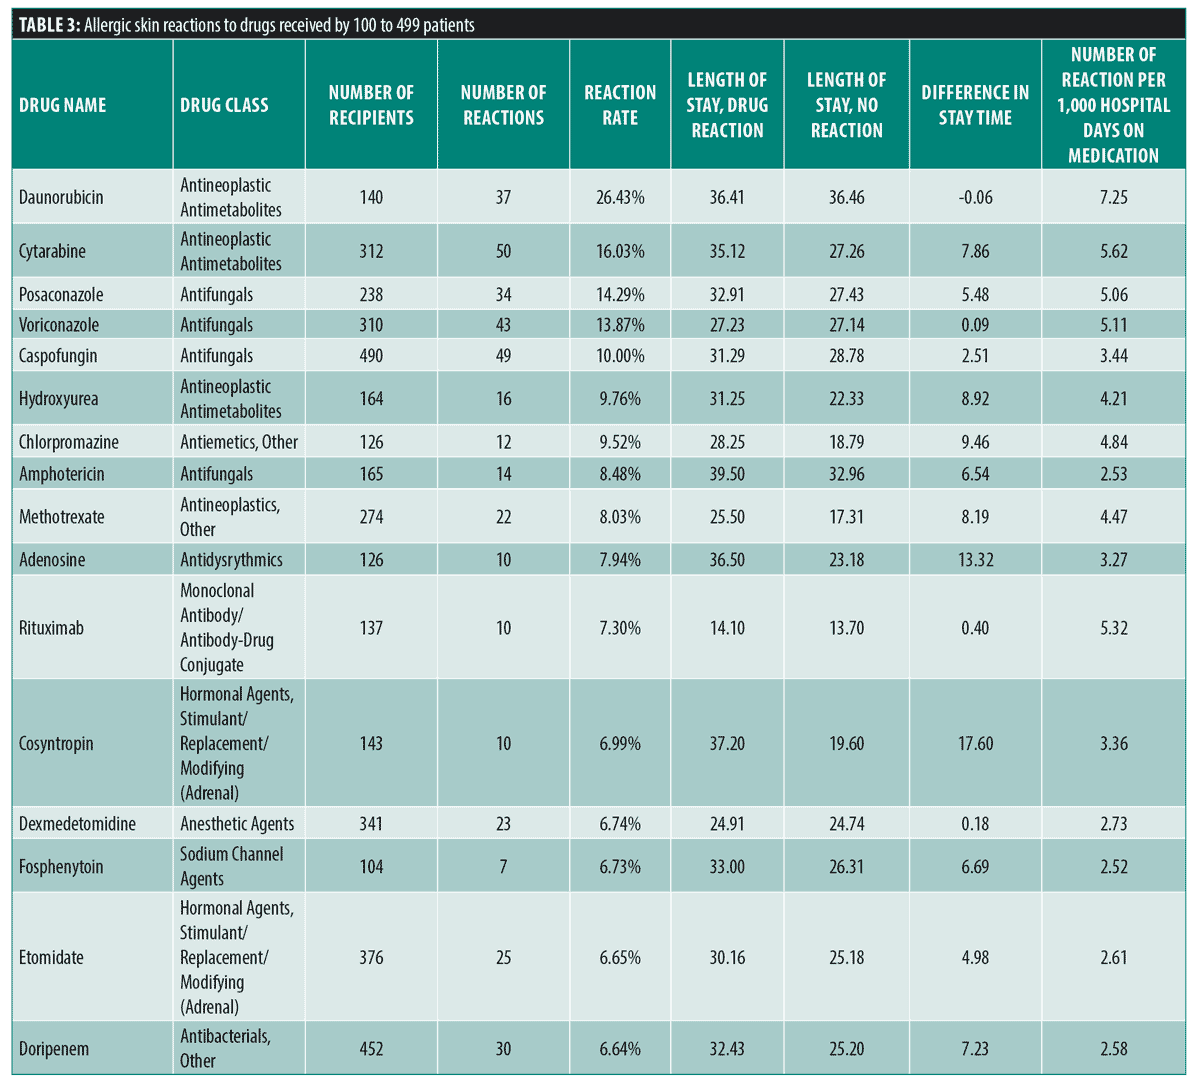
The frequency of cutaneous drug eruptions for drugs received by between 100-499 patient-hospitalizations that had greater than 2.5 times average (6.45%) reaction frequency are displayed in Table 3. Many medications with the greatest reaction frequencies were antineoplastic and antifungal medications including: daunorubicin (26.43%), cytarabine (16.03%), posaconazole (14.29%), voriconazole (13.87%), caspofungin (10.00%), hydroxyurea (9.76%), amphotericin (8.48%), methotrexate (8.03%) and rituximab (7.30%).

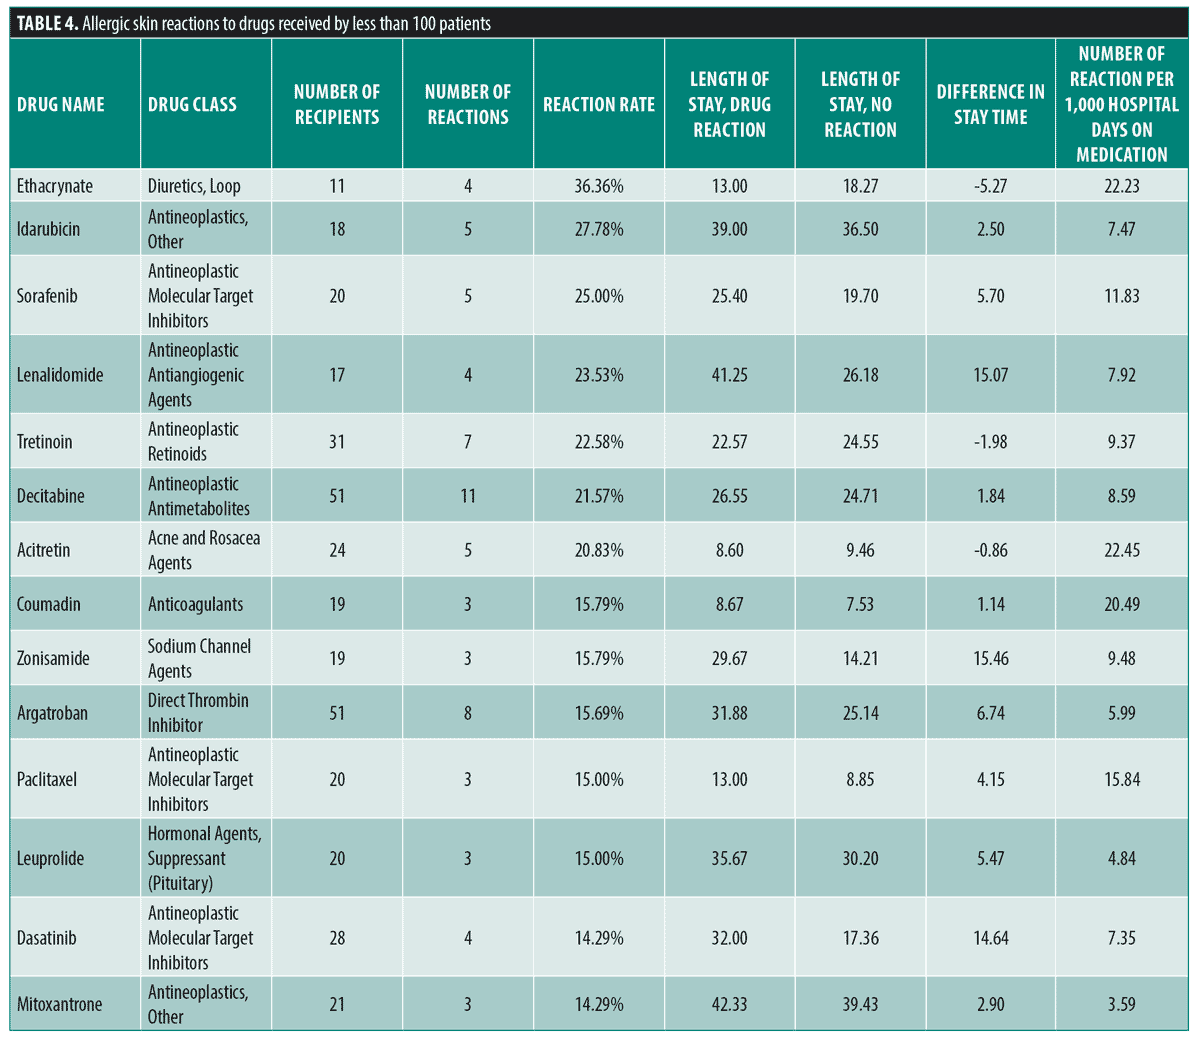
The frequency of cutaneous drug eruptions for drugs received by less than 100 patients that had greater than five times average (12.9%) reaction frequency are displayed in Table 4. The medications in this table that have notably high reaction rates includes five antineoplastic medications with a reaction frequency greater than 20 percent including: idarubicin (27.78%), sorafenib (25.00%), lenalidomide (23.53%), oral tretinoin (22.58%), and decitabine (21.57%).

Discussion
The current study isolated results similar to that of the 1986 Bigby study,12 finding an overall reaction rate of 2.58 percent as compared to the 2.2 percent reaction rate in the previous study. However, these two studies found major differences in which medications are most commonly associated with drug reactions. For example, the highest reaction rates in the Bigby study for drugs received by 1,000 or more patients were amoxicillin (5.14%), trimethoprim (3.38%), and ampicillin (3.32%), contrasting to the current study where these drugs demonstrated approximately half of the reaction rate at 1.22%, 1.88%, and 1.64% respectively,12 which are generally consistent with previously published clinical trial adverse events.13 We postulate that the noted decrease in reaction rates to these medications is likely due to increased use of better tolerated non-sulfa and non-aminopenicillin antibiotics, but secondly may be related to an increased use of sharing allergy and childhood history via the Electronic Health Record (EHR).14 In particular, the reaction rate of trimethoprim/sulfamethoxazole is likely decreased by the frequency of patients utilizing the regimen chronically for pneumocystis prophylaxis.15
The primary difference between the two studies is the presence of many drug types—most notably antineoplastic and antifungals— that were associated with a reaction rate greater than eight percent in the current study, whereas the Bigby study only reported one therapy, platelets (44.8%), as having a reaction rate greater than eight percent. This is partly due to the older study attributing each drug reaction to only a single assumed medication whereas we approached any hospitalization medicine as a possible etiology. Secondly, at the time that data collection for the Bigby study was completed in 1982, there were only 27 chemotherapeutic agents approved by the US Food and Drug Administration (FDA), and only two of these: cyclophosphamide (0.48%) and vincristine (0.63%) even appeared in the study.16 As of 2014, there have been 150 chemotherapeutic medications approved by the FDA, and 32 of these medications were taken by greater than 0.1 percent of the cohort, and thus were included in our study.16 Of the chemotherapeutic agents included, 17 of the 32 medications had a hospital reaction rate greater than eigth percent, with five chemotherapeutic medications being associated with a hospital reaction rate over 20 percent. Of the agents with the highest risk in this category, cytarabine and daunorubicin—which are typically associated with a 7 + 3 day course for acute myelogenous leukemia—our data supports previous studies of these drugs as a frequent cause of a papulopurpuric eruption.11 Interestingly, as opposed to many other medications in the study, these eruptions do not typically occur until 7 to14 days after completion of the course11,17 and similar delayed reactions may be observed in purine analogues.18 Likewise, of the four antifungal medications that were highly associated with drug eruptions in the current study—posaconazole (14.29%), voriconazole (13.87%), caspofungin (10.00%), and amphotericin (8.48%)—only amphotericin B was approved at the time of the Bigby study. Of note, patients undergoing treatment or prophylaxis with these treatments, and treatments such as anxiolytics, antivirals, sleep-aids, laxatives, and anti-diarrheals, tended to overlap frequently with the oncology patients, therefore, due to the agnostic evaluation of each medication, the medications that are commonly co-administered with purine analogs such as antiemetics, sleep aids, and anti-diarrheals potentially have a falsely elevated reaction rate due to the high rate of prescription of these medications in chemotherapy patients.19,20,21
Limitations. A limitation of the study is that the data was analyzed in a binary format and not as a time-dependent exposure. This led to medications which are often prescribed for the drug eruption such as diphenhydramine, famotidine, and prednisone, appearing as having a high reaction rate when in reality, it is a bias of indication. We believe that this limitation inflated the reaction rates of second-line antibiotics for patients that experienced a drug eruption from more common antibiotics, namely: aztreonam, daptomycin, and possibly cefepime. Thus, the data needs to be interpreted with the context that all medications during the hospitalization were considered to be at risk and the average hospital reaction rate was 2.58 percent.
Despite this limitation, this paper offers updated data and a more current medication profile for hospitalists and dermatologists to evaluate risks in the context of polypharmacy and hospitalizations. This data demonstrates the complexity of studying the topic of drug eruptions in the hospital setting. As demonstrated with hospitalization risks, a patient’s current medication list may not reflect the causative agent, and dermatologists should maintain a high index of suspicion and consider previous therapies, especially among patients undergoing hematologic cancer therapies. Context is critical in establishing drug causation. Future analyses will be important to evaluate the risk while attempting to control for time, immune reconstitution, metabolites, allergies, method of administration, and other at-risk covariates.
References
- Falanga V, Schachner LA, Rae V, et al. Dermatologic Consultations in the Hospital Setting. Arch Dermatol. 1994 Aug;130(8):1022–1025.
- Gerson D, Sriganeshan V, Alexis JB. Cutaneous drug eruptions: A 5-year experience. J Am Acad Dermatol. 2008;59(6):995–999.
- Rademaker M, Oakley A, Duffill MB. Cutaneous adverse drug reactions in a hospital setting. N Z Med J. 1995 May;108(999):165–166.
- Holland KE, Soung PJ. Acquired Rashes in the Older Child. Nelson Pediatric Symptom-Based Diagnosis. Elsevier. 2018; pp 866–896.
- Sastre J, Manso L, Sanchez-García S, et al. Medical and economic impact of misdiagnosis of drug hypersensitivity in hospitalized patients. J Allergy Clin Immunol. 2012;129(2):566–567.
- Pettit C, Patterson A, Trinidad J KB. Cutaneous Morphologies are Associated with Hospital Outcomes. J Am Acad Dermatology
- Naranjo C, Busto U, Sellers E, et al. A method for estimating the probability of adverse drug reactions. Clin Pharmacol Titer. 1981;30(2):239–245.
- Jarvis LM. The new drugs of 2019. C&EN Glob Enterp. 2020;98(3):30–36.
- United States Census Bureau. Explore Census Data [Internet]. 2000
- USP DC | USP [Internet]. [cited 2020 Aug 6]. Available from: https://www.usp.org/health-quality-safety/usp-drug-classification-system
- Ruben BS, Yu WY, Liu F, et al. Generalized benign cutaneous reaction to cytarabine. J Am Acad Dermatol. 2015;73(5):821–828.
- Bigby M, Jick S, Jick H, et al. Drug-Induced Cutaneous Reactions: A Report From the Boston Collaborative Drug Surveillance Program on 15 438 Consecutive Inpatients, 1975 to 1982. JAMA J Am Med Assoc. 1986;256(24):3358–3363.
- Krispinsky AJ, Shedlofsky LB, Kaffenberger BH. The frequency of low-risk morbilliform drug eruptions observed in patients treated with different classes of antibiotics. Int J Dermatol. 2020;59(6):647–655.
- Evans RS. Electronic health records: then, now, and in the future. Yearb Med Inform. 2016;(Suppl 1):S48.
- Klinker H, Langmann P, Zilly M, et al. Drug monitoring during the treatment of AIDS‐associated Pneumocystis carinii pneumonia with trimethoprim‐sulfamethoxazole. J Clin Pharm Ther. 1998;23(2):149–154.
- Sun J, Wei Q, Zhou Y, et al. A systematic analysis of FDA-approved anticancer drugs. BMC Syst Biol. 2017;11(5):1–17.
- Cetkovská P, Pizinger K, Cetkovský P. High-dose cytosine arabinoside-induced cutaneous reactions. J Eur Acad Dermatology Venereol. 2002;16(5):481–485.
- Wang RF, Kuehn GJ, Andritsos LA, et al. Cutaneous adverse events associated with purine analogs in the treatment of hairy cell leukemia. Int J Dermatol. 2018 Nov
- Schnell FM. Chemotherapy‐induced nausea and vomiting: the importance of acute antiemetic control. Oncologist. 2003;8(2):187–198.
- Stein A, Voigt W, Jordan K. Chemotherapy-induced diarrhea: pathophysiology, frequency and guideline-based management. Ther Adv Med Oncol. 2010;2(1):51–63.
- Sateia MJ, Lang BJ. Sleep and cancer: recent developments. Curr Oncol Rep. 2008;10(4): 309– 318.

