 J Clin Aesthet Dermatol. 2023;16(2 Suppl 1):S16–24.
by Margaret A. Bobonich, DNP, FNP-C, DCNP, FAANP; Veronica Richardson, MSN, ANP-C, DCNP; and Sotero Alvarado, MA
Dr. Bobonich is Assistant Professor at Case Western Reserve University in Cleveland, Ohio, and Founder of Center for Dermatology Nursing Practice in Silver Lake, Ohio. Ms. Richardson is with Penn Dermatology, Perelman Center for Advanced Medicine, at the University of Pennsylvania in Philadelphia, Pennsylvania. Mr. Alvarado is Professor of Mathematics at Arizona Western College in Yuma, Arizona.
FUNDING: No funding was provided for this article.
DISCLOSURES: Dr. Bobonich has served on the advisory boards and/or speakers bureaus of Boehringer Ingelheim, Bristol Myers Squibb, Dermavant, Eli Lilly, and AbbVie. Ms. Richardson has served on the advisory boards of Boehringer Ingelheim, Bristol Myers Squibb, Dermavant, Eli Lilly, and Leo Pharmaceuticals. Mr. Alvarado has no conflicts of interest relevant to the content of this article.
Introduction
The dermatology landscape has been rapidly changing to meet the rising demand for dermatology care in the United States (US). According to the Dermatology Workforce Supply Model: 2015-2030, keeping pace with the demand for dermatologic care will require the adoption of a team-based approach and greater reliance on nurse practitioners (NPs) and physician assistants (PAs).1 But there is a dearth of detailed information about the workforce characteristics of NPs and PAs specializing in dermatology. The aim of this survey was to identify workforce characteristics and compensation for dermatology NP and PA clinicians.
Survey Design
Dermatology NPs and PAs were invited to participate in a brief 10-minute survey emailed to 7,132 subscribers of the Journal of Clinical and Aesthetic Dermatology’s supplement journal series, NP+PA Perspectives in Dermatology. The survey was conducted between December 28, 2022, and February 3, 2023. Participants who completed the survey could be entered into a drawing to win one of two gift cards. The survey consisted of 22 questions, including demographics, gender, educational degree, clinical experience, hours worked, type of dermatology services provided, practice setting, and staffing. Respondents were also asked to provide information about their productivity, billing, compensation, and benefits. There was a range of possible answers to questions involving quantitative data, with the exception of the continuing education budgeted amount variable. Several graphs illustrate how different observed variables may relate to each other, but the etiology of these variations were not assessed. The reported median salary range includes all respondents and does not differentiate between part-time and full-time. Since only salary categories were reported, repeated values for each class midpoint were used to find the confidence interval (CI).
Survey results
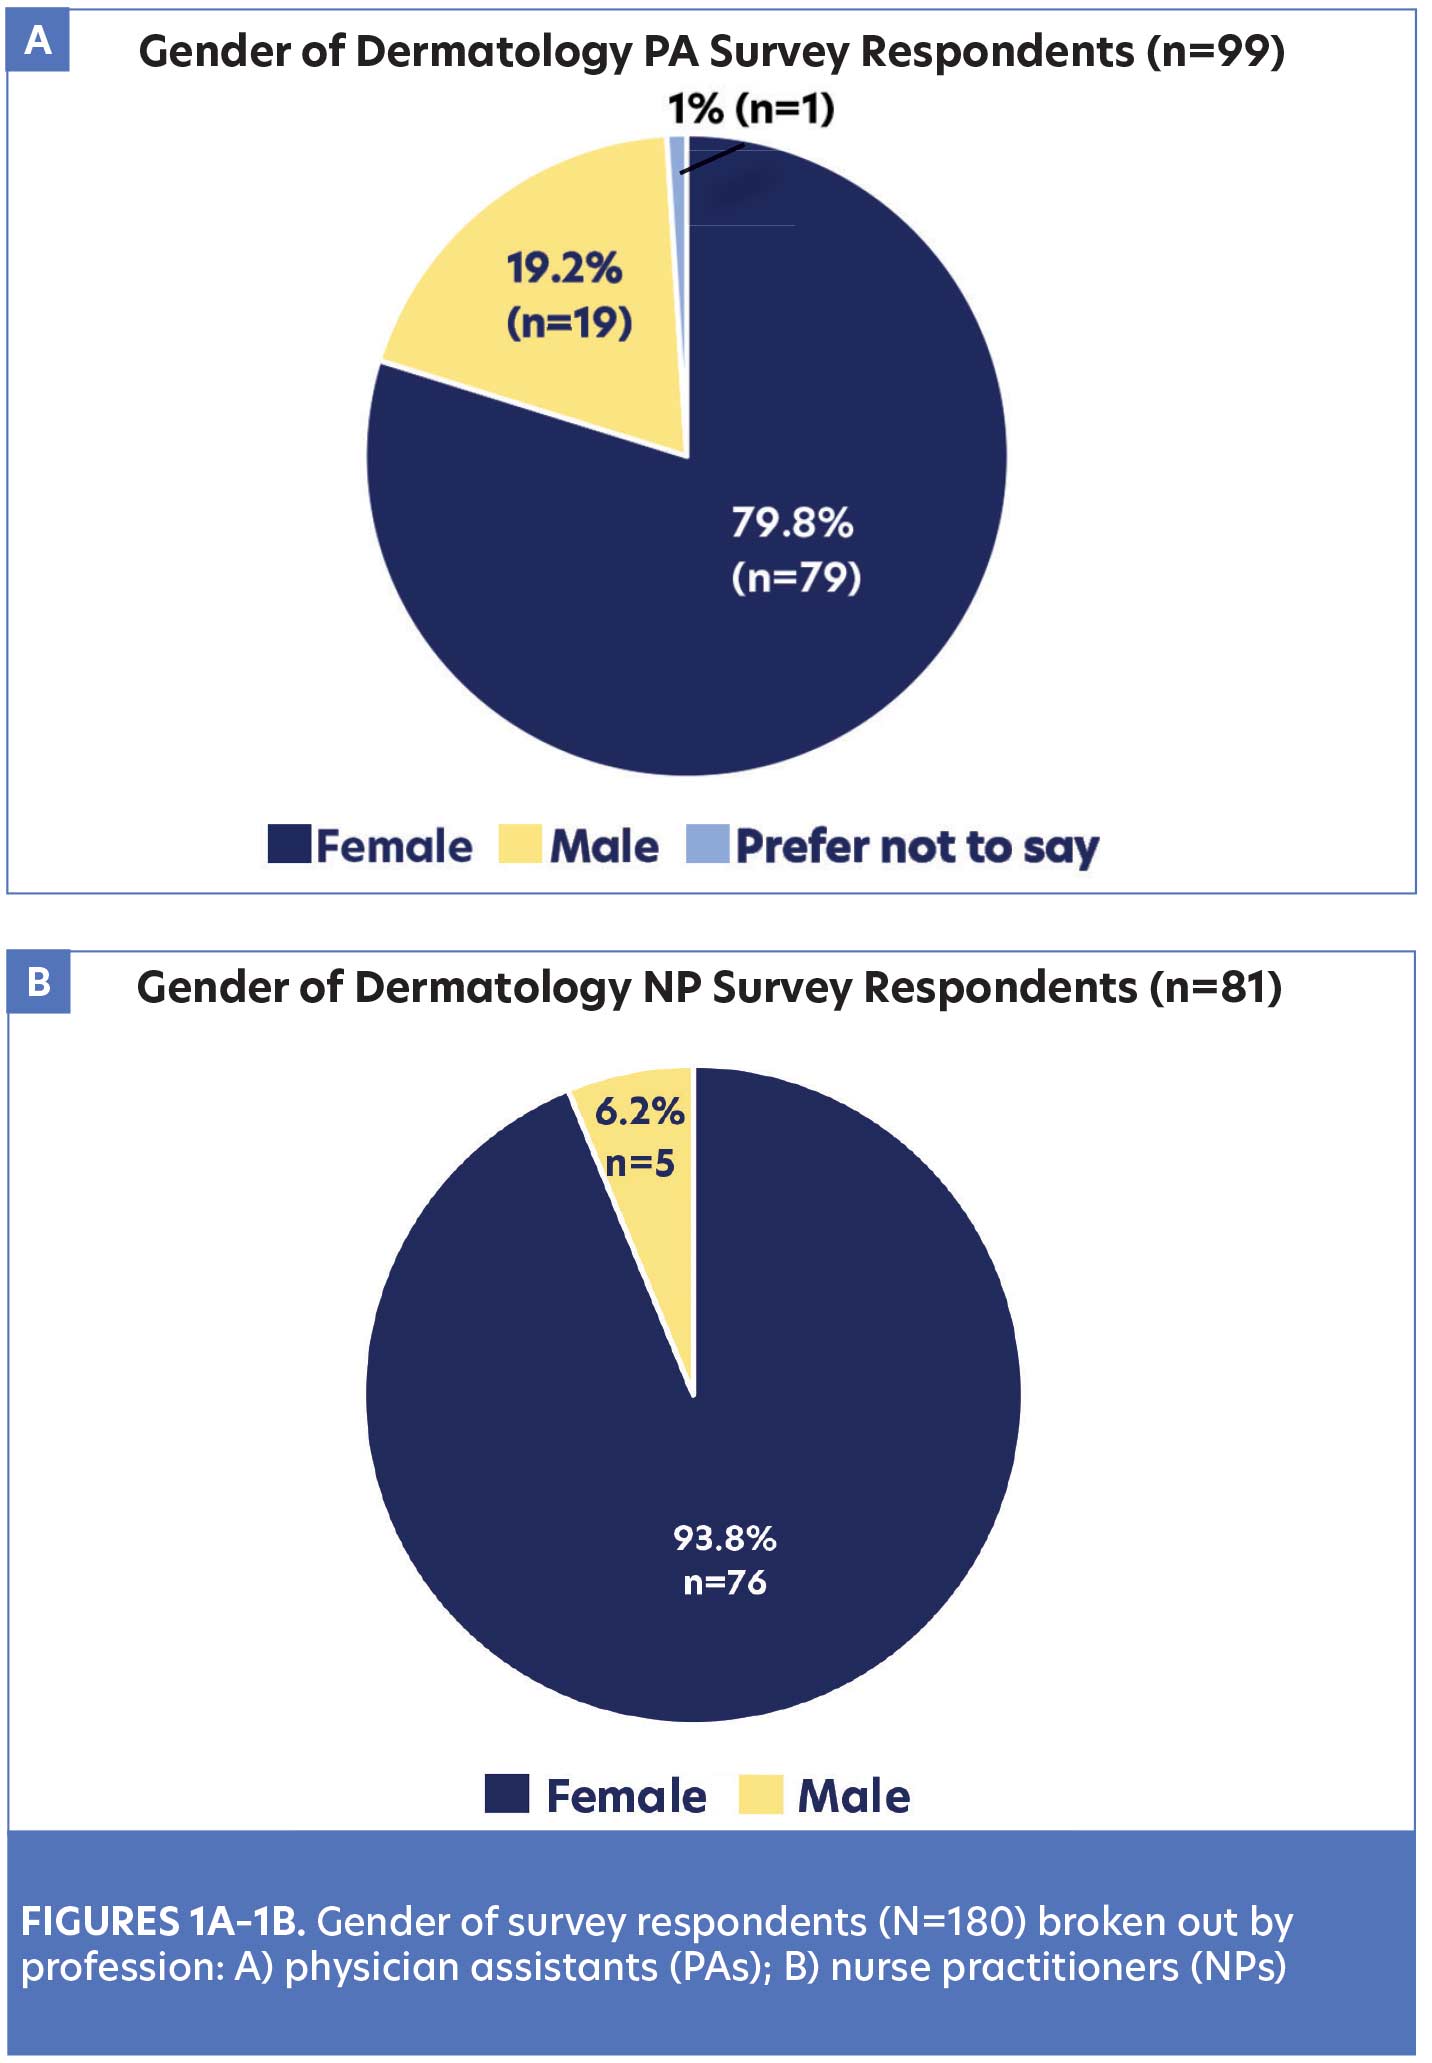
Demographics. There were 180 respondents who completed the survey. Of the respondents, 55 percent were PAs and 45 percent were NPs; 38 states across the US were represented by respondents. Further analysis shows the percentage of gender by profession (Figures 1A–1B).
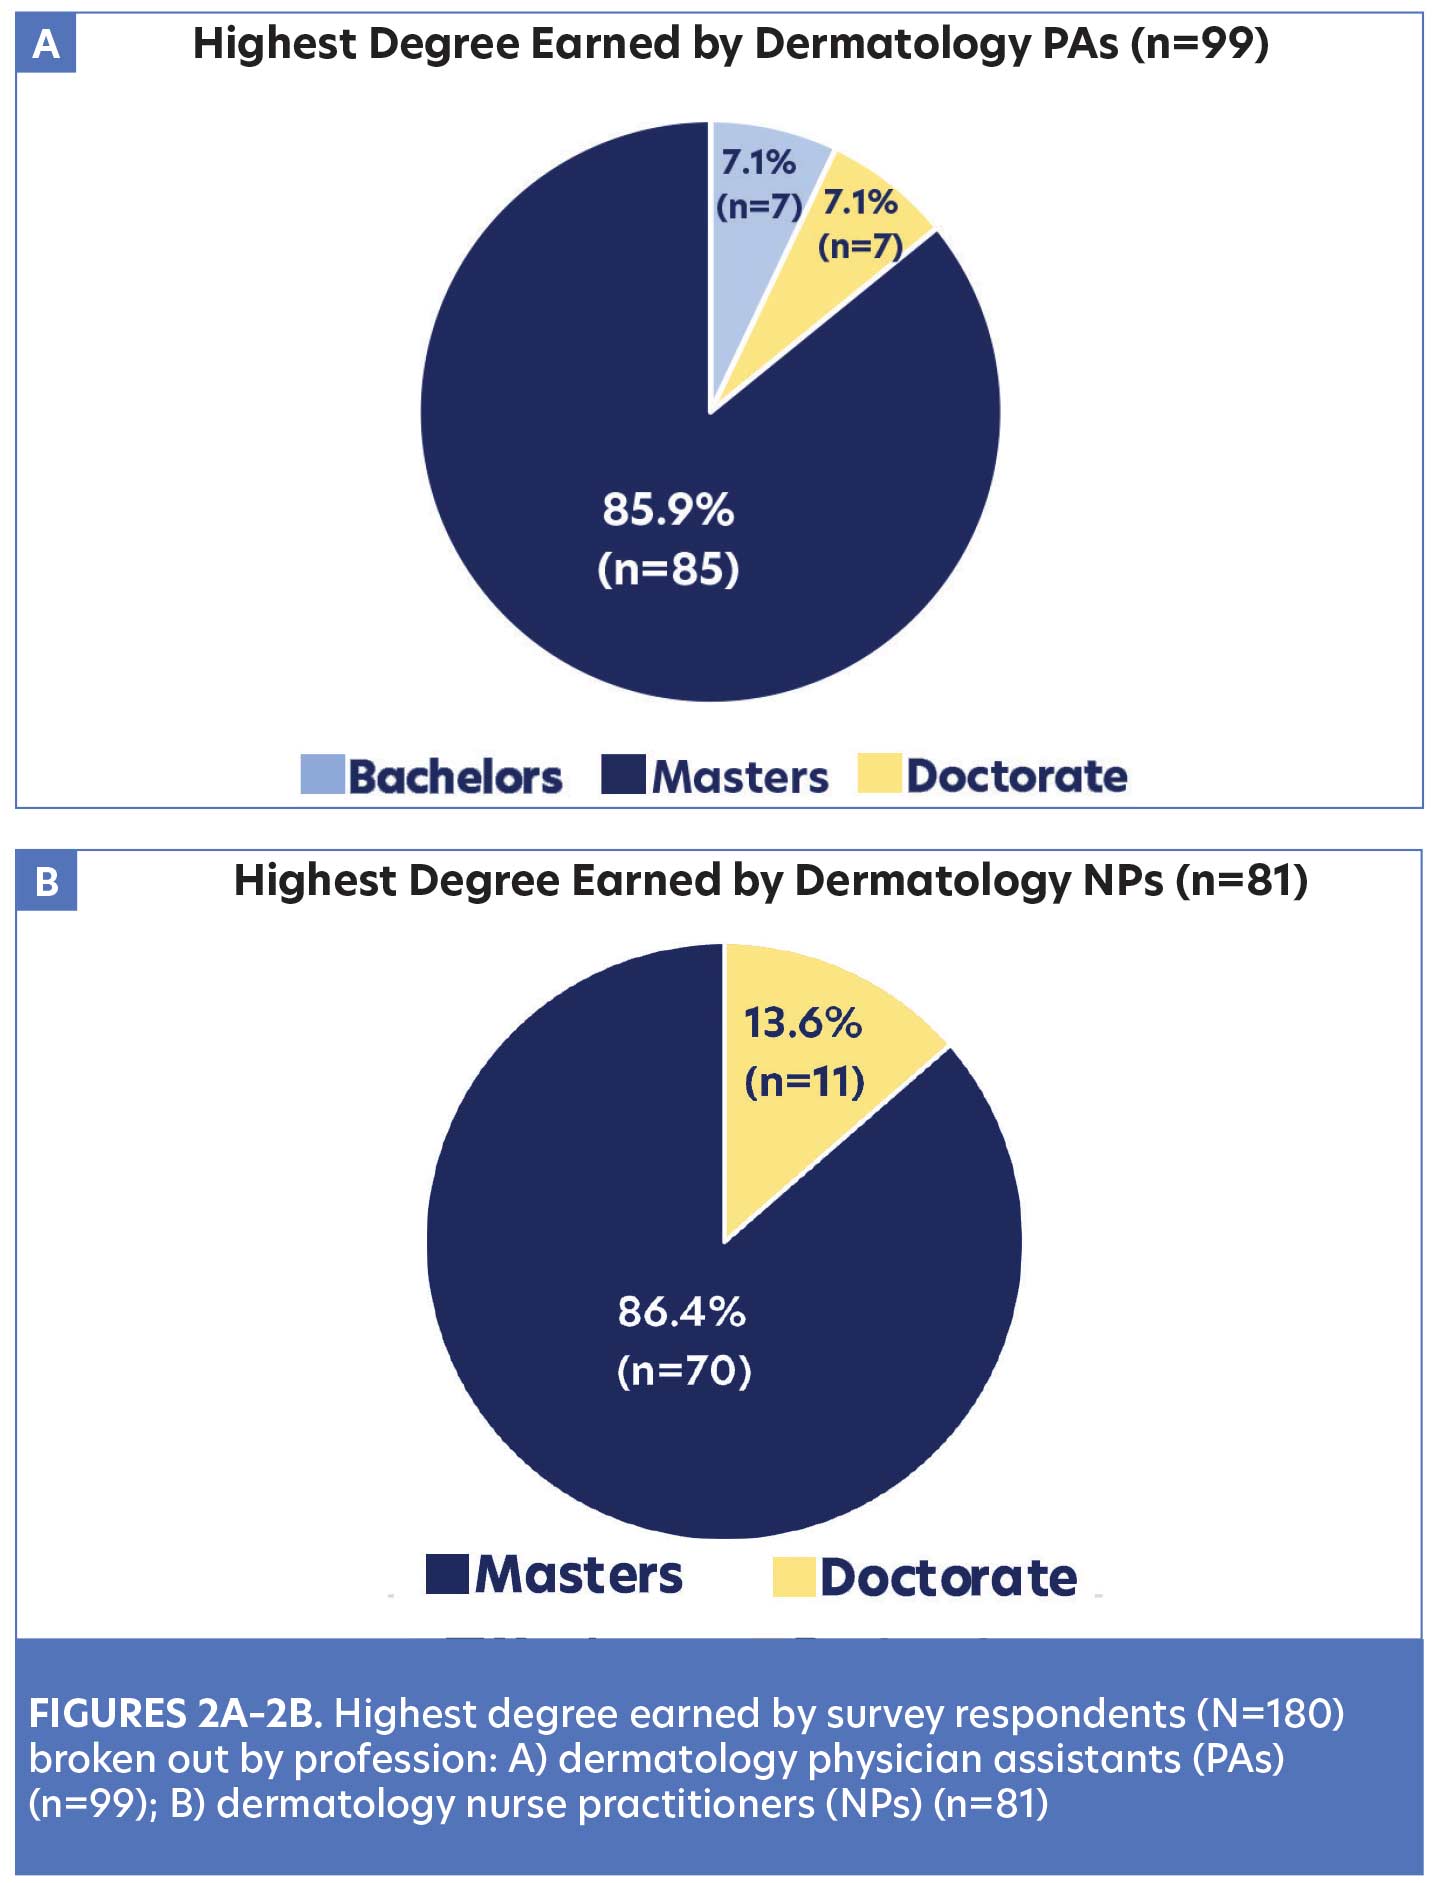
Clinical experience is an important attribute for all healthcare professionals and can impact hiring and terms of employment. The survey showed 43 percent of dermatology NPs and PAs had 11 or more years of experience, 25 percent had 6 to 10 years of experience, 18 percent had 4 to 6 years of experience, and 14 percent had 1 to 3 years of experience. Although educational preparation, licensure, and regulations are unique for each profession, 86 percent of the respondents held a master’s degree. There were 14 percent of NPs and seven percent of PAs who reported having doctoral degrees (Figures 2A–2B).
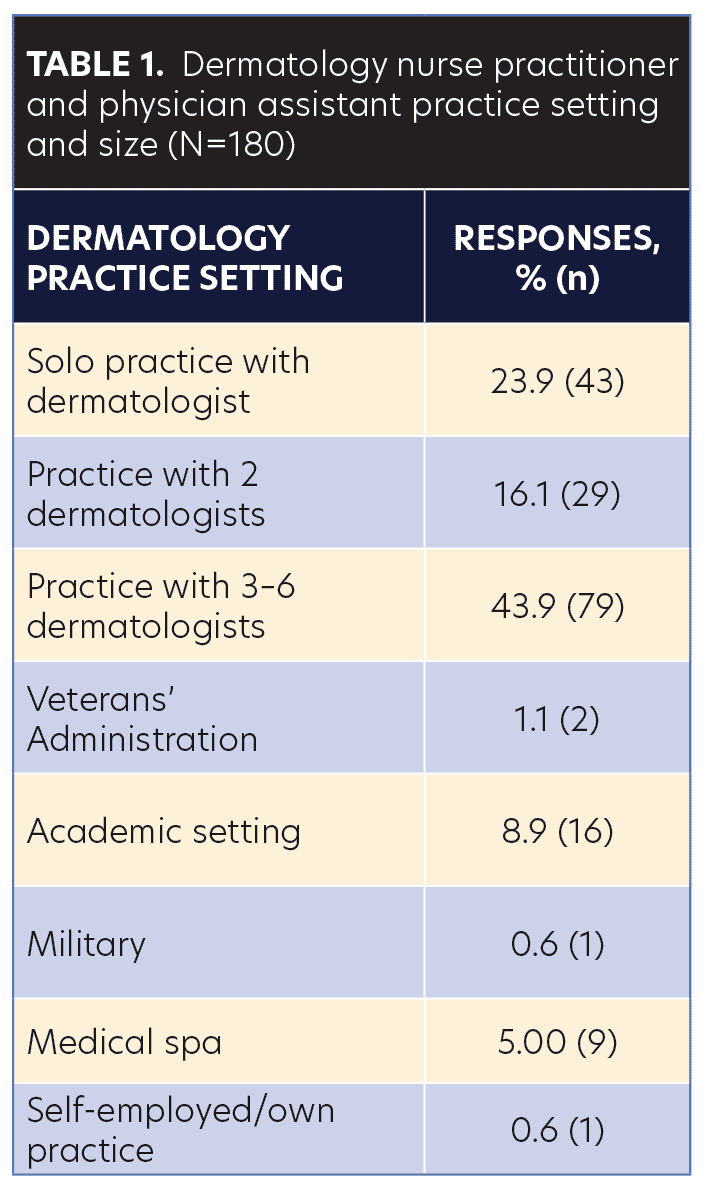
Practice setting and staffing. As dermatology care continues to transform, practice setting and staffing can vary considerably. The majority of respondents (44%) reported working in large practices with a group of 3 to 6 dermatologists (Table 1). This is consistent with trends that show dermatology group practices were likely to hire advanced practice clinicians.2 Similarly, dermatology practices often employ more than one NP or PA and include multiple practice locations. Forty-six percent of the survey respondents reported working with 2 to 4 other NP and/or PA colleagues, 23 percent reported working with 5 to 9 NP and/or PA colleagues, and 14 percent reported working with more than 10 other NP and/or PA colleagues. Only 17 percent of the respondents reported being the only advanced practice provider in their practice.
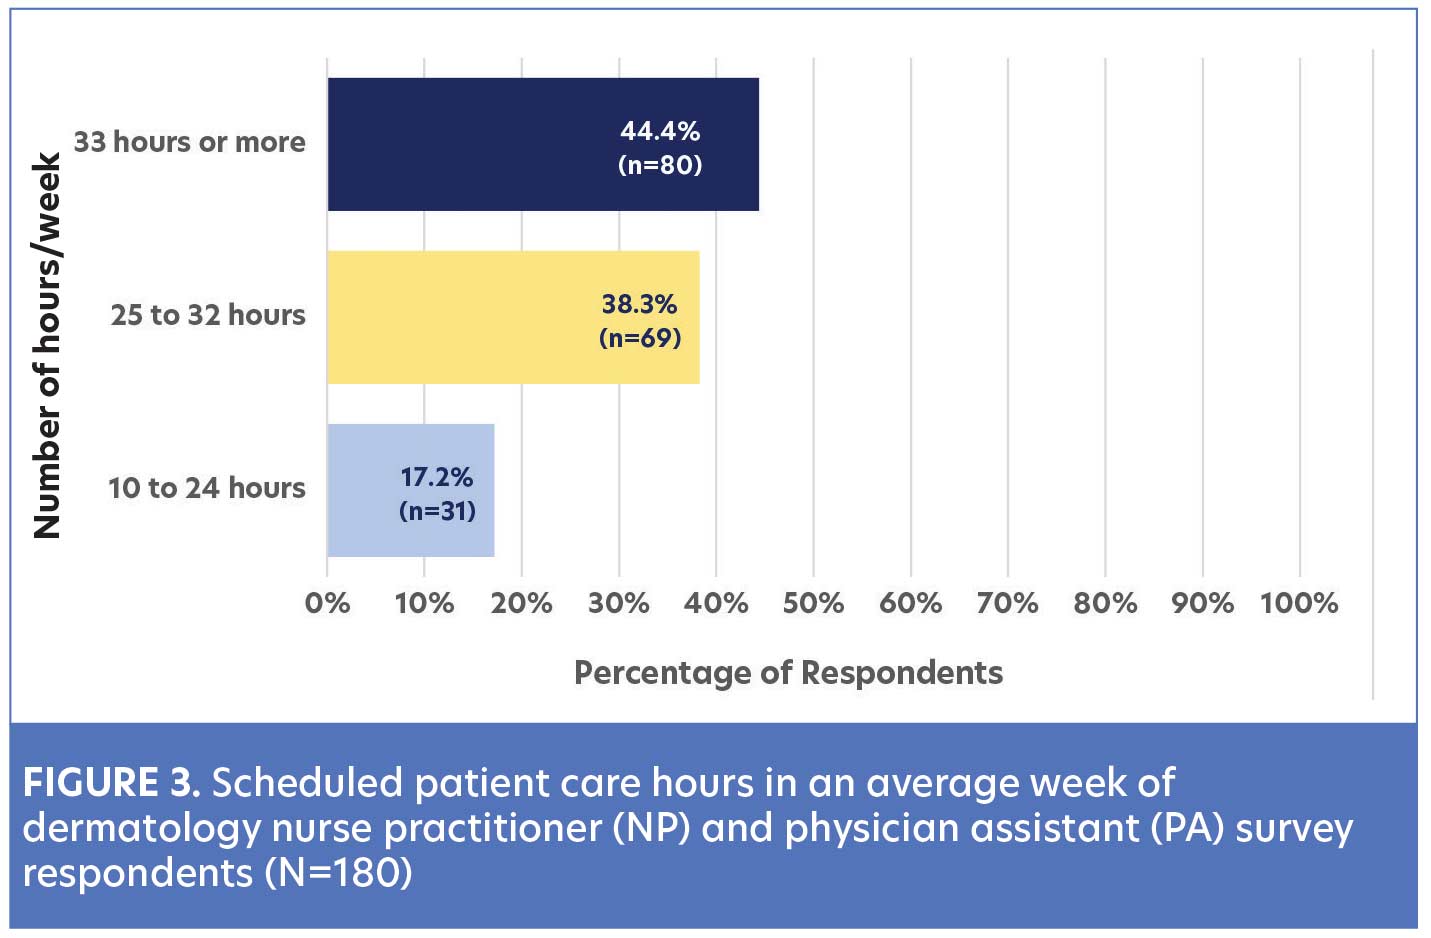
Numerous changes in the dermatology workforce have impacted the scheduled hours of patient care among providers. Given the variable definition of “part-time” and “full-time” employment, survey participants were asked to select from different categories of scheduled patient care hours in an average week. Most dermatology NPs and PAs (44%) reported they worked an average of at least 33 hours a week, which could be considered full-time practice. Thirty-eight percent of respondents reported working an average of 25 to 32 hours a week, and 17 percent reported working an average of 10 to 24 patient care hours a week (Figure 3).
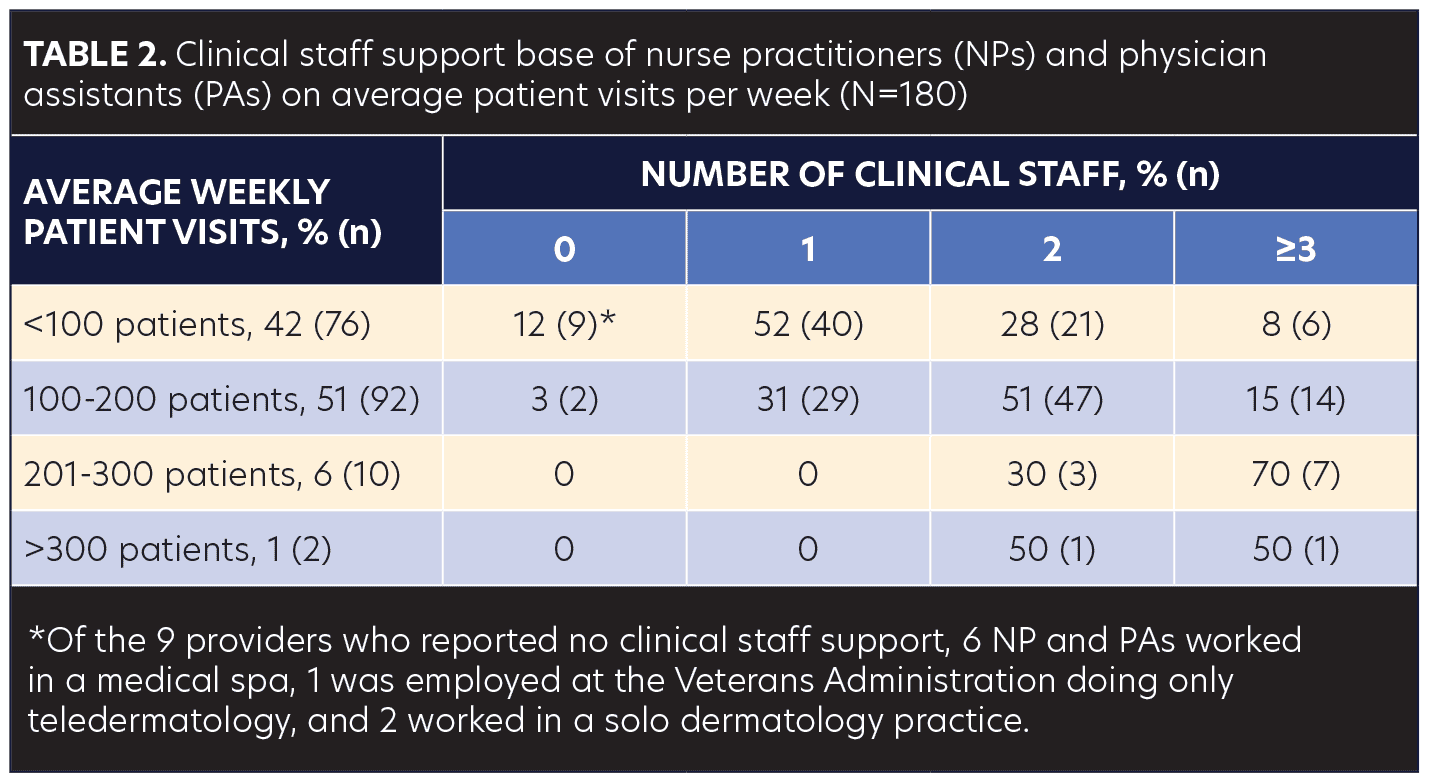
Clinical staff support is variable in dermatology practices and can have a direct impact on quality of care, efficiency, and productivity. In this survey, respondents were asked to identify the number of clinical staff they were provided for support, including medical assistants or scribes. Of the NPs and PAs who reported seeing 100 to 200 patients a week, 31 percent reported they had one clinical staff, 51 percent had two staff, and 15 percent had three staff for support. Table 2 presents further details about staffing trends based on the weekly number of patients seen by the providers. Consideration was also given to the unique administrative burden of preauthorizations that dermatology NPs and PAs who prescribe therapies such as biologics often encounter. While 69 percent of respondents had a clinical staff member to assist with these responsibilities, 23 percent had a biologic coordinator or pharmacist to assist in the process. Only eight percent of the respondents reported they were required to complete preauthorizations, including insurance denials, without any staff support.
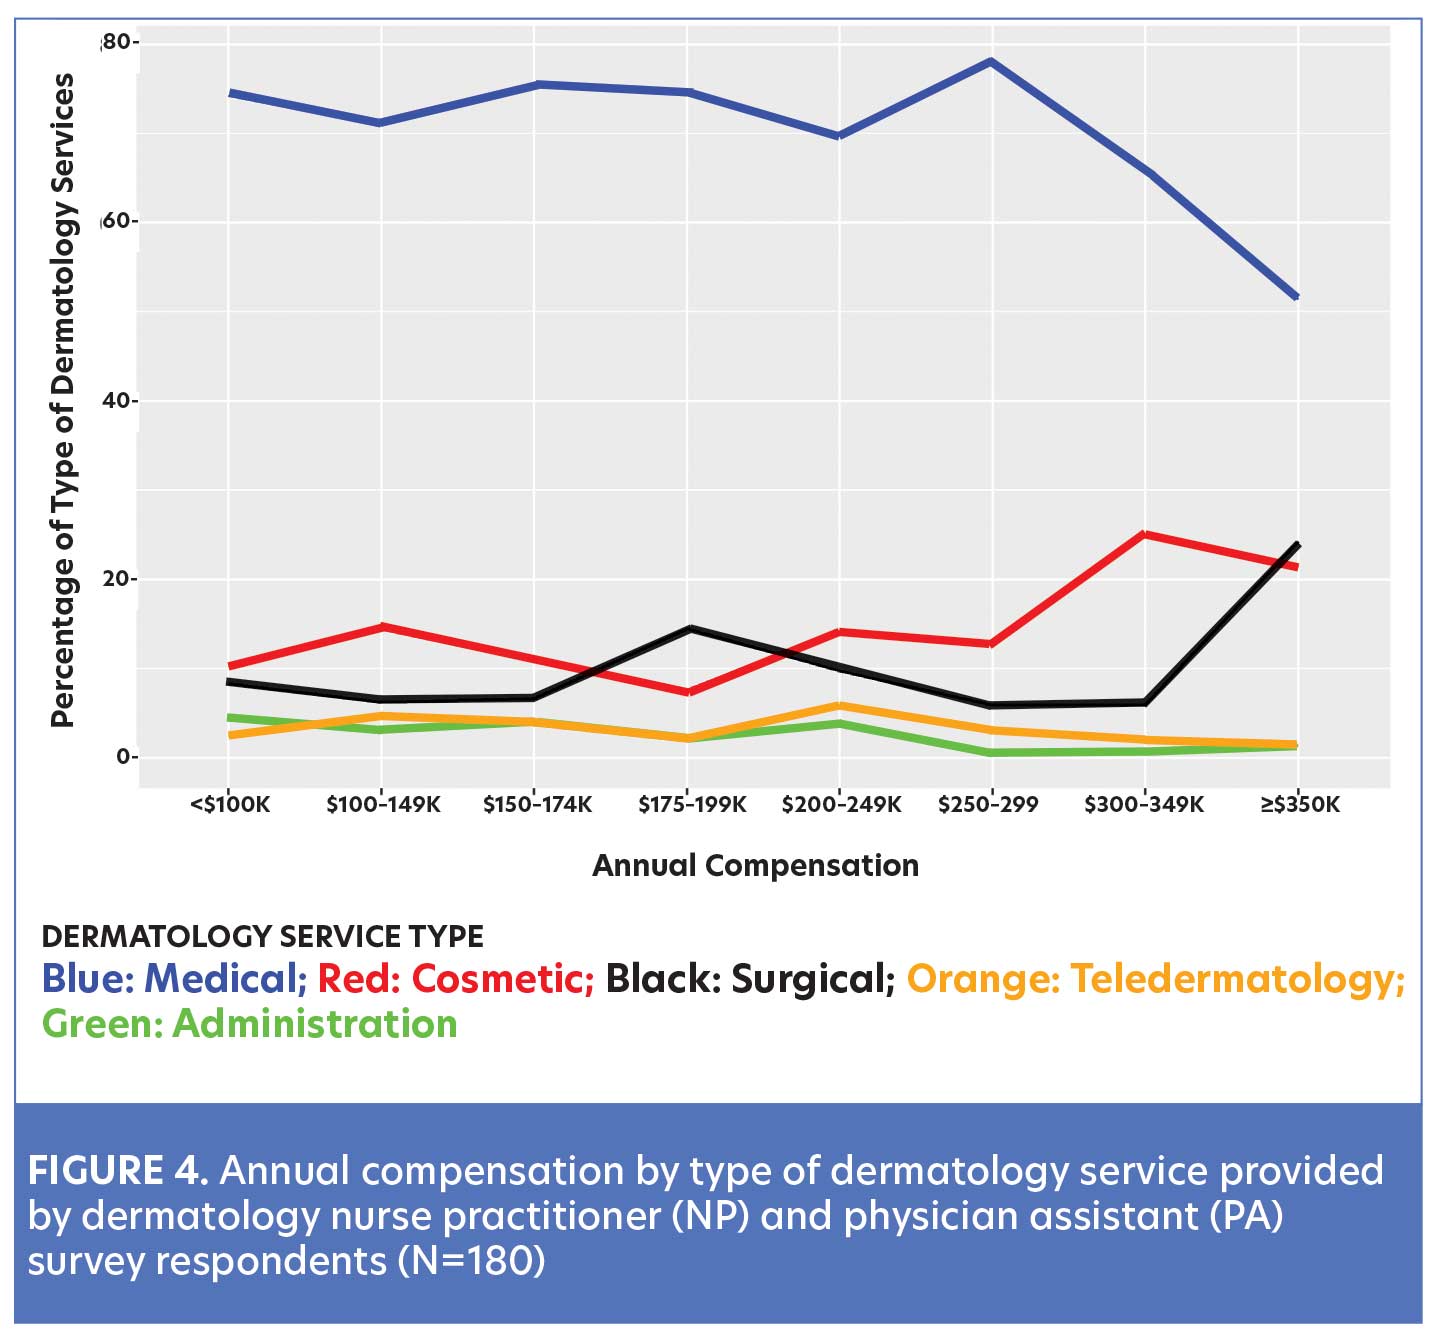
Type of dermatology services. Dermatology NPs and PAs are engaged in a wide spectrum of clinical dermatology services and administrative responsibilities. Moreover, the type and frequency of these services may impact generated revenue, reimbursement rates, and provider compensation. Dermatology services examined in this survey included general medical dermatology, surgical dermatology, cosmetic dermatology, teledermatology, and administrative services. NPs and PAs were asked to allocate the percentage of their practice in each of the areas. The composite of services were individualized to each survey respondent and challenging to summarize, given the outliers in every category. Overall, the majority (82%) of dermatology NPs and PAs performed a mixture of general dermatology, surgery, cosmetics, telehealth, and administrative duties. There were, however, a small subset of respondents that exclusively provided cosmetic (7%), telemedicine (2%), or surgical services (1%). Interestingly, dermatology NPs and PAs who earned less than $250,000 provided mostly general dermatology and a small percentage of cosmetic and surgical dermatology services. A trend was noted among respondents who earned more than $250,000; these respondents had a lower percentage of general dermatology and higher percentage of surgical and cosmetic services (Figure 4).
Payor mix. Acceptance of insured, underinsured, or uninsured patients has a direct impact on the finances of any practice, as well as on access to care for patients. This survey showed that 88 percent of dermatology NPs and PAs accepted Medicare and Commercial/ACO/PPO insurance. However, only 44 percent of dermatology NPs and PAs worked in practice settings that accepted Medicaid insurance, and 33 percent accepted uninsured/underinsured patients outside of Medicaid. Self pay was accepted by 83 percent of the respondents, but does not necessarily translate to cash-only services.
Billing. Insurance billing is one the most critical aspects of practice finances and requires accuracy and timeliness. Respondents were asked to identify various aspects of their billing practices. The submission of billing can be done under the dermatology NP’s or PA’s national provider identifier (NPI). The alternative is using incident-to billing that is unique to advanced practice providers and submitted under the collaborating/supervising physician’s NPI. According to our survey, 76 percent of dermatology NPs and PAs submitted billing under their own NPI number, while only 16 percent billed under incident-to guidelines. Additionally, six percent of respondents did not bill but received cash for services, and two percent reported that they did not submit billing for revenue.
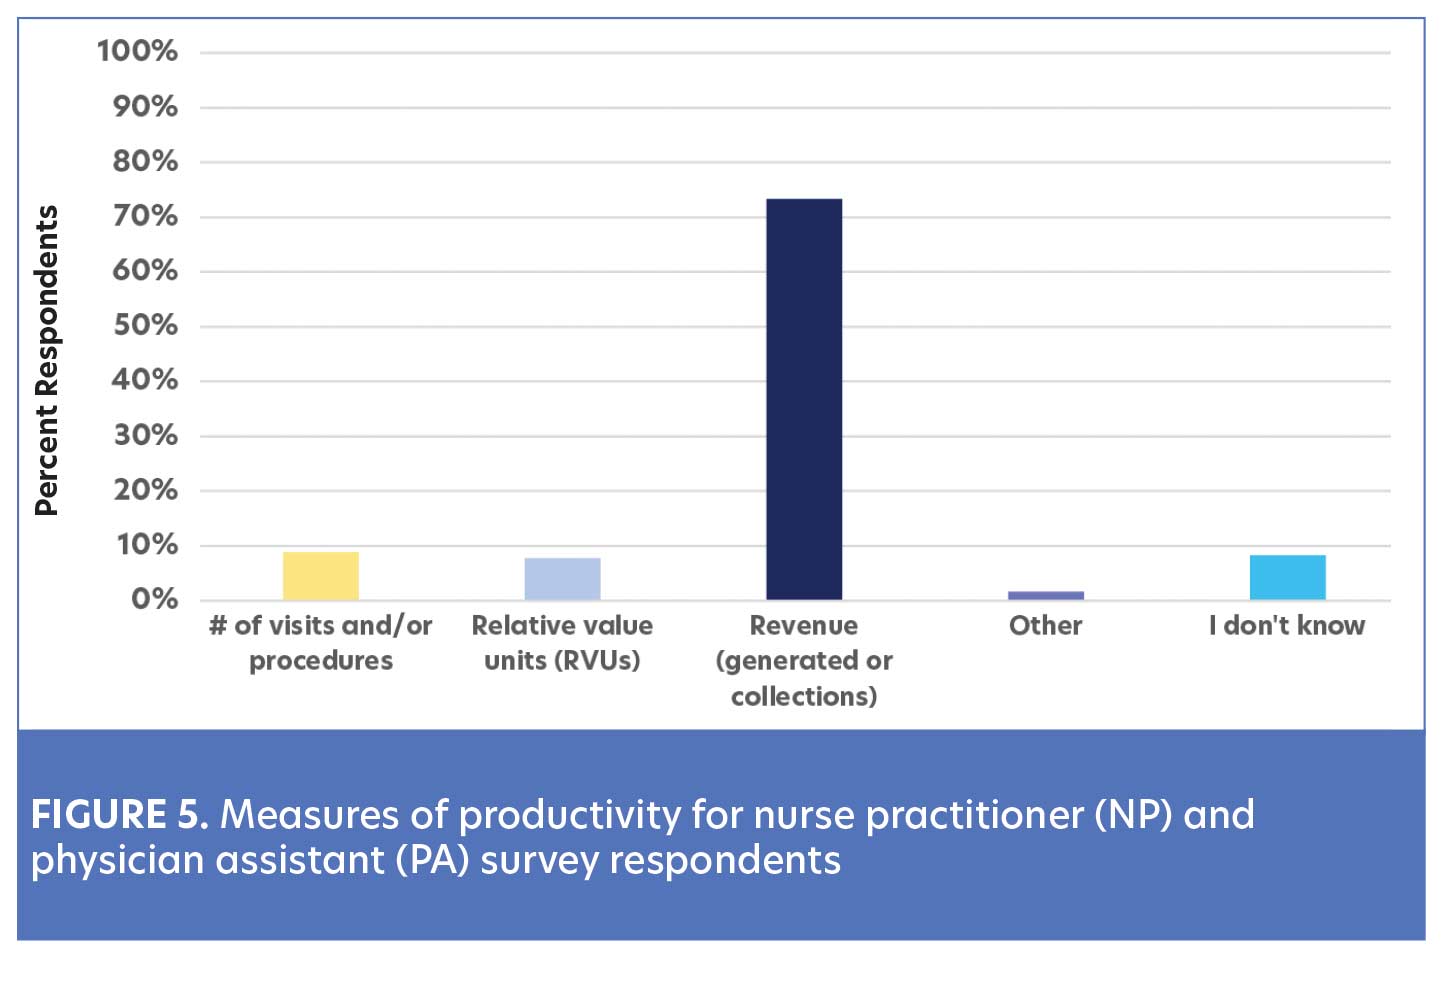
Productivity. Measure of productivity. Survey respondents were asked to identify how their productivity was measured and the frequency of which they received productivity reports from their employer. Most dermatology NPs and PAs (92%) were knowledgeable of how their productivity was measured, whereas eight percent were unaware (Figure 5). Moreover, the majority of respondents (52%) received monthly productivity/revenue reports from their employer, compared to 21 percent who received them quarterly, and five percent who received them annually. Interestingly, 22 percent of respondents did not receive any type of regular productivity/revenue report (Table 3). Of those respondents who billed under their own NPI, 20 percent were not provided with productivity/revenue reports from their employer.

Patient visit volume and generated revenue. Patient visits are a commonly used metric utilized to measure productivity. However, they do not always correlate directly with generated revenue or collections. There was great variability in the number of patient visits seen by dermatology NPs and PAs who responded to our survey. More than half (51%) saw 100 to 200 patients visits per week. Forty-two percent saw less than 100 patients per week, with the vast majority (71%) of NPs and PAs in this group working 10 to 24 patient care hours per week, which could be considered part-time. Only seven percent of dermatology NPs and PAs respondents saw more than 200 patient visits per week.
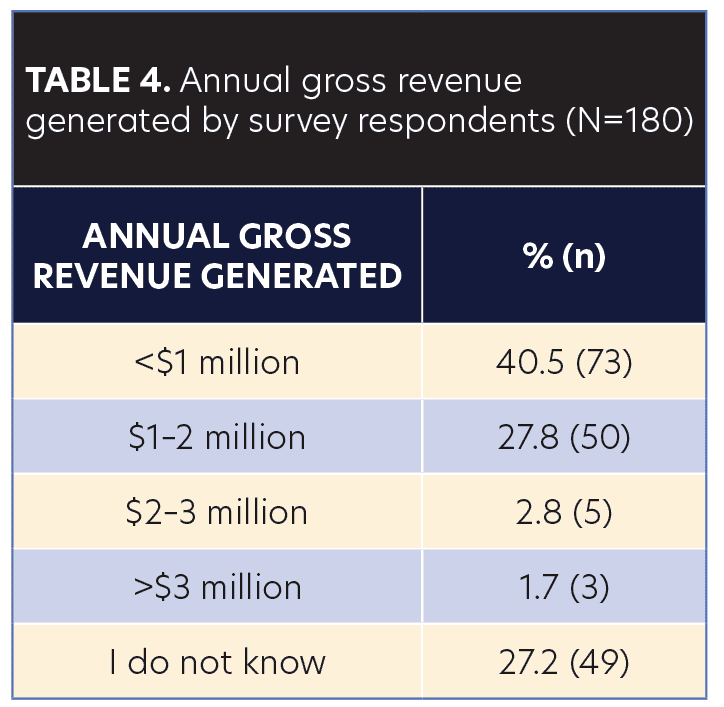
The generated revenue by dermatology NPs and PAs in this survey was important to examine, as it is closely linked to productivity, practice finances, and annual compensation. Table 4 highlights the annual gross revenue generated by the respondents. It should be noted that 27 percent of dermatology NPs and PAs did not have knowledge of their gross annual revenue for their services.
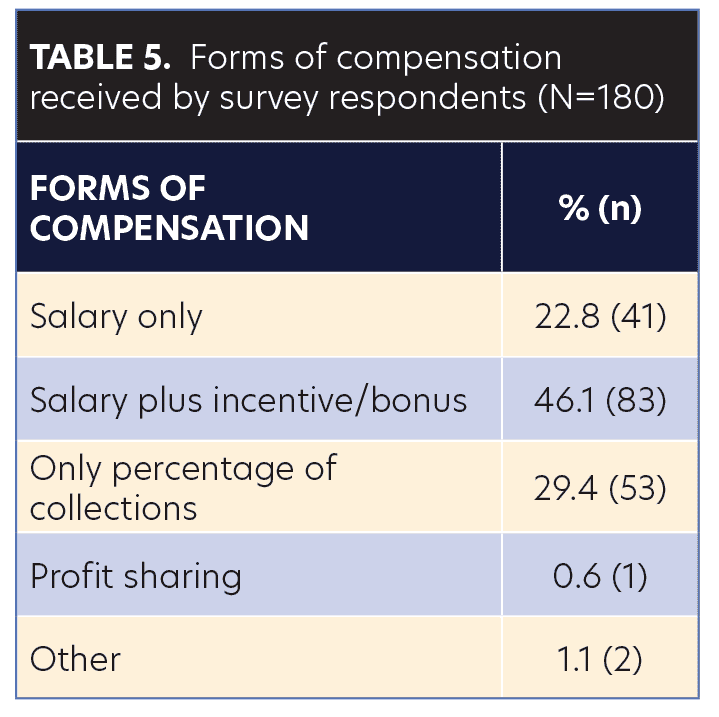
Compensation. Compensation is complex and can consist of salary and non-salaried benefits. It is a critical element in negotiating employment terms. Thus, it is helpful to identify variables that may influence those terms. Dermatology NPs and PAs reported compensation through various methods, including salary plus bonus/incentive, salary only, percentage of collections only, and profit sharing (Table 5).
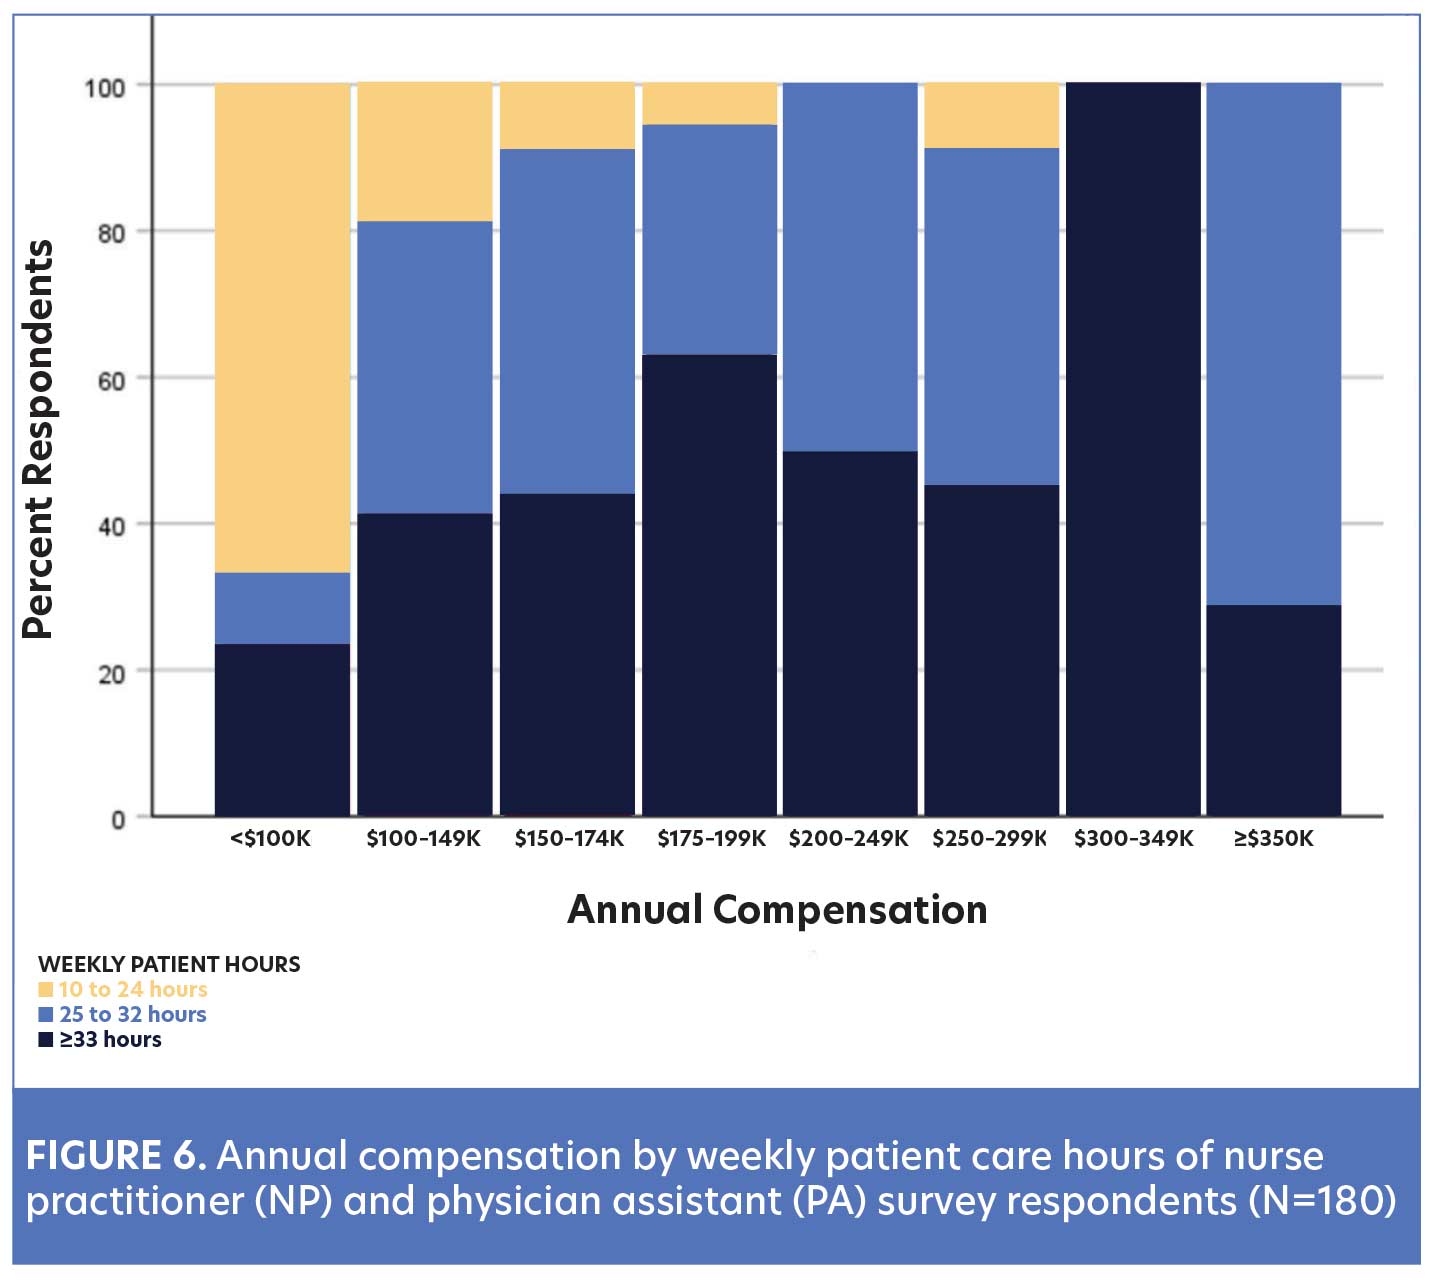
Total annual compensation. The survey required respondents to report their total annual compensation range. The overall median compensation range of dermatology NPs and PAs respondents was calculated to be $125,000 to $162,500 with a 99-percent CI. Figure 6 illustrates the distribution of annual compensation and patient care hours. Two-thirds of dermatology NPs and PAs who earned less than $100,000 worked 10 to 24 patient care hours per week. Almost one-third (29%) of dermatology NPs and PAs reported they earned between $150,000 and $199,000 annually, and 23 percent reported earning over $200,000 annually. In addition to patient care hours as noted above, type of dermatology services provided may also influence dermatology NP and PA annual compensation. Figure 4 suggests compensation trends based on the type of dermatology services provided.
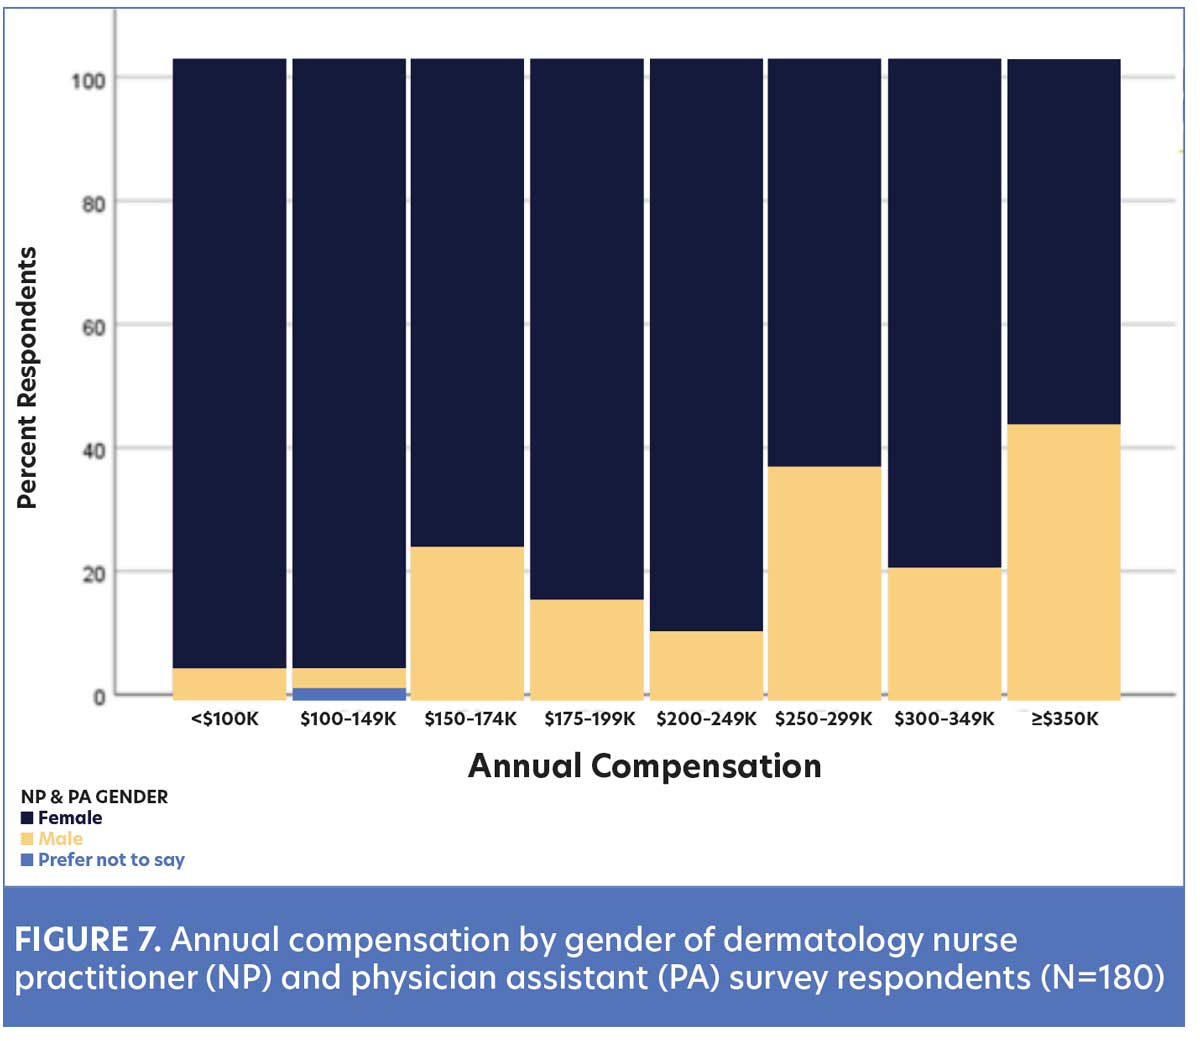
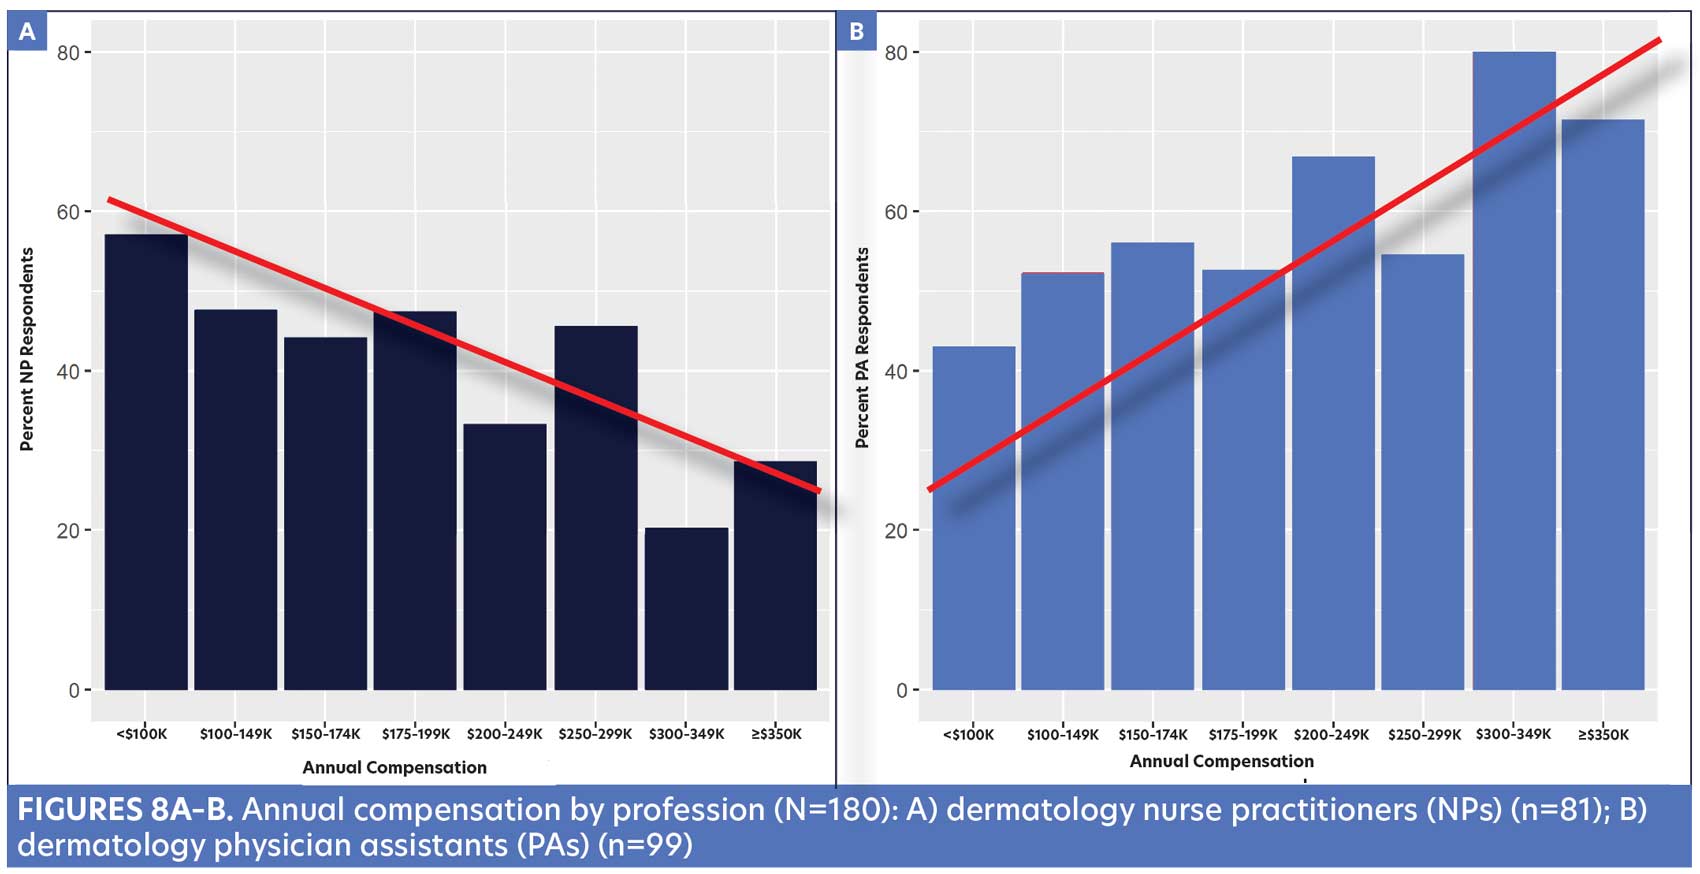
Dermatology NPs and PAs most often reported they received salary plus an incentive/bonus as part of their compensation. Of note, 85 percent of those respondents who were compensated with salary alone were female. This prompted a further examination of the salary distribution based on reported gender (Figure 7) and profession (Figure 8).
Benefits offered by employer. When compensation packages are designed, there can be a variety of value-based elements in addition to salary. Dermatology NP and PA respondents reported receiving nonsalary benefits, including health insurance (84%), paid time off (76%), retirement plan or deferred compensation (77%), and employer-paid malpractice (96%). Fifty-six percent of respondents reported receiving all five benefits from their employer.
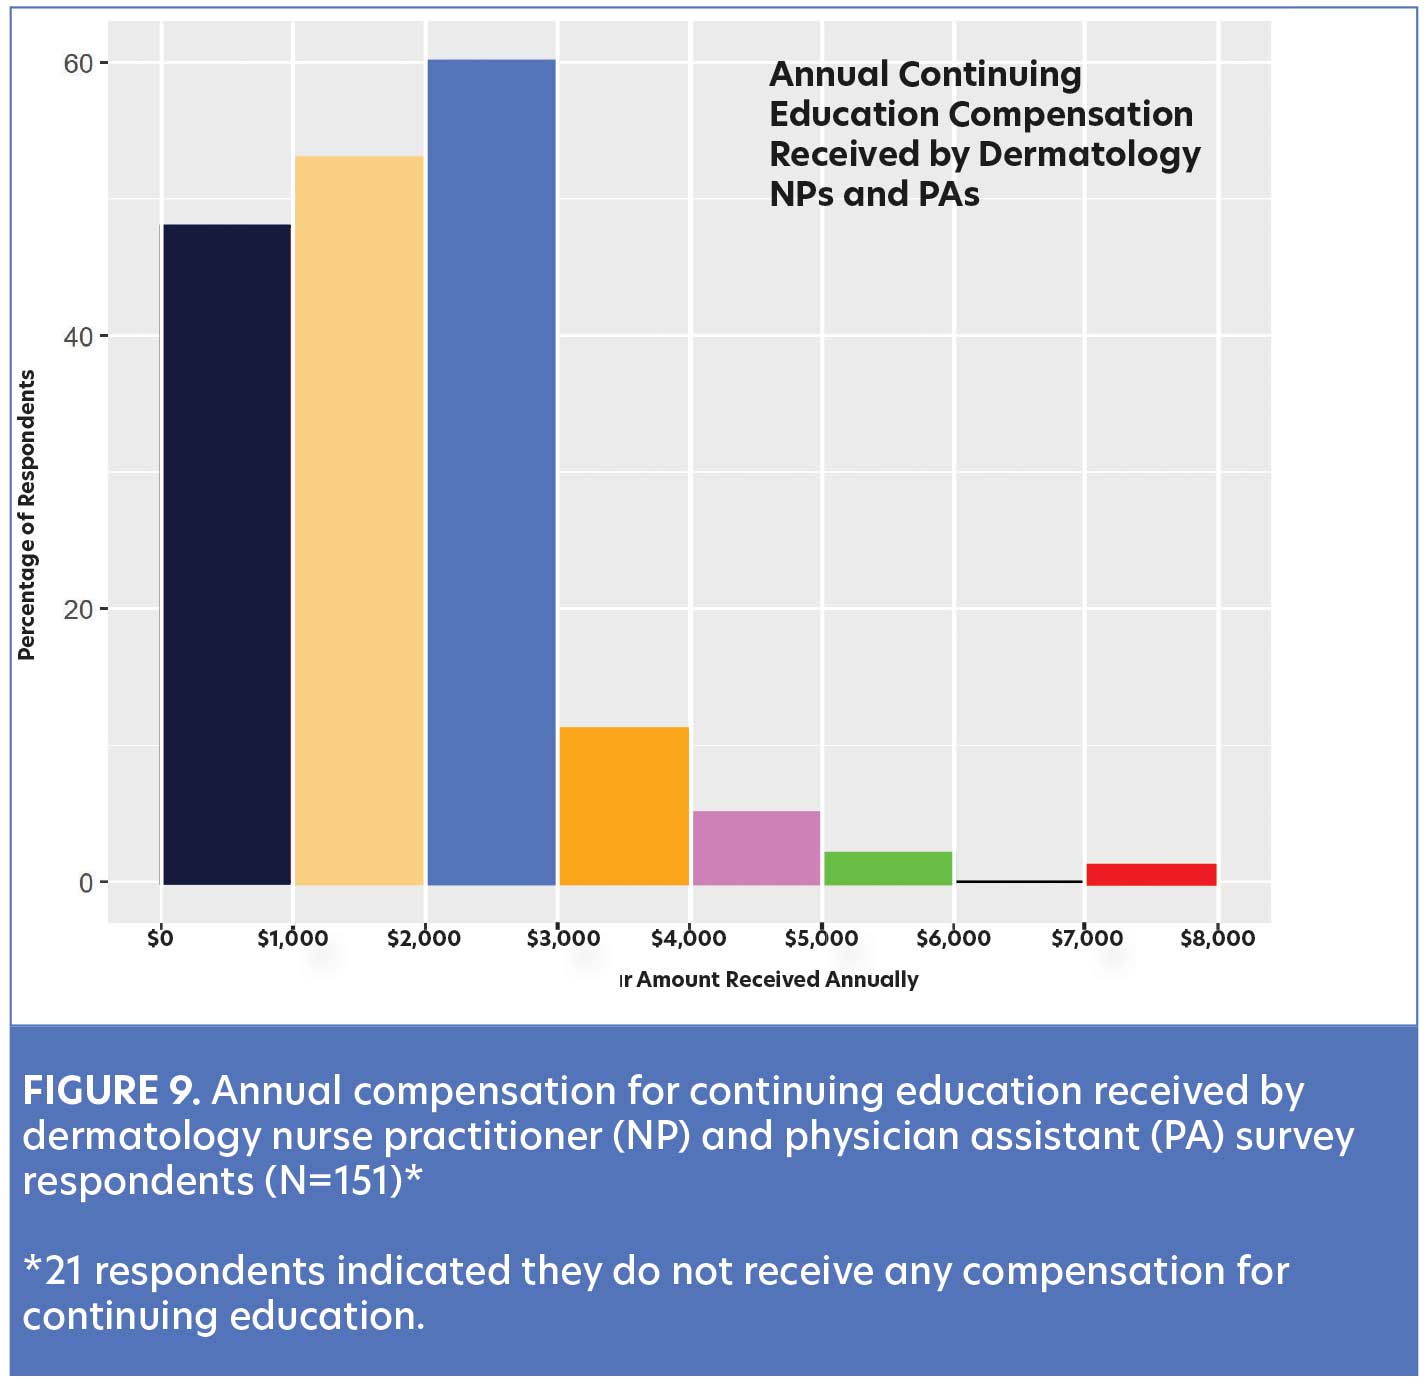
Continuing education (CE) funds or reimbursement is another benefit that was examined in the survey. This is especially important since CE is required for licensure and maintenance of certification for all dermatology NPs and PAs. The vast majority (87%) of respondents reported receiving CE funds ranging from $500 to $7,500 annually (Figure 9).
Discussion
The specialty of dermatology has been especially challenged over the past two decades in response to the growing demand for quality patient care. There are numerous influencing factors, trends, and predictions about the dermatology workforce shortage and limited access to care in the US.1 Without the continued growth of NPs and PAs, it is unlikely that dermatology practices can keep pace with the demand. Understanding the characteristics of NPs and PAs specializing in dermatology is integral to the adoption of a team-based approach. Therefore, it is important to identify the number of advanced practice clinicians and characteristics of their employment in today’s dermatology practices.
Professional societies and agencies have recognized and published on the robust growth of dermatology NPs and PAs. The American Academy of Dermatology’s 2017 practice profile survey noted the rising trend in the employment of advanced practice providers.2 Dermatologists who employed at least one PA or NP increased from 25 percent in 2005 to 46 percent in 2014. It was also noted that dermatologists in group practices were more likely to utilize PAs compared to those in solo practices (54% vs. 34%). Findings from our survey are consistent with this trend.
A frequently asked question remains: How many NPs and PAs specialize in dermatology? Sargen et al’s workforce supply model in 20151 assumed that 3.3 percent of all certified PAs (based on 98,470 licensed PAs) practiced in dermatology, with a 30-percent growth projection over 10 years. The National Commission on Certification of Physician Assistants (NCCPA) noted the rising number of dermatology PAs from 4,350 in 2020 to 4,580 in 2021, with a new projected growth rate of 4.1 percent.3,4
Census on the number of dermatology NPs in the US has not been as consistent or easily identified, compared to PAs. The American Association of Nurse Practitioners (AANP) 2013–14 National Nurse Practitioner Practice Site Census reported approximately 3,500 NPs specializing in dermatology.5 This AANP estimate was much higher than Sargen et al’s workforce model1 in 2015 that projected that 0.3 percent of all certified NPs worked in dermatology. In 2020, the AANP reported there were 290,000 licensed NPs in the US and completed another sample survey from 3,994 respondents.6 Although there was no specific sample size identified for dermatology, there was a reported increase in distribution to 0.5 percent of NPs specializing in dermatology. Currently, there are 355,000 licensed NPs in the US, including 36,000 who graduated from their academic program in the years 2020 to 2021. Otherwise, there is no current estimate of the number of dermatology NPs in practice.7
This survey reports on some of the characteristics of dermatology NPs and PAs. It is not surprising that compensation is a key element when discussing employment opportunities, as well as career advancement. A fundamental aspect of salary negotiation is understanding your own value, as well as the market range in your specialty. However, compensation data for the specialty have been particularly limited. The 2017 Society of Dermatology Physician Assistants (SDPA) salary survey (N=1,080) reported that 21 percent of dermatology PAs in the US earned between $150,000 to $200,000, while 15 percent reported earning more than $200,000.8 By comparison, the 2017 National Nurse Practitioner Sample Survey reported the mean salary for dermatology NPs (N=19) was $141,352 (standard error of $11,514).9 Data from our survey identified the median annual compensation range of $125,000 to $162,500 for dermatology NPs and PAs. Moreover, 29 percent of the respondents earned between $150,000 and $199,000, and 23 percent reported earning more than $200,000 annually.
Productivity is an important element of dermatology NP and PA practice and can be impacted by type of dermatology services, scheduled patient hours, and staffing support. Eighty-two percent of surveyed NPs and PAs reported providing a blend of dermatology care, compared to 18 percent who reported limiting their practice exclusively to general dermatology, cosmetic, surgical, or teledermatology patients. Interestingly, a trend in the data showed that NPs and PAs who earned less than $250,000 reported that the largest percentage of their provided services was in general dermatology, with a low percentage of their services being offered in cosmetic or surgical treatments. Conversely, dermatology NPs and PAs who earned $250,000 or more reported providing a larger proportion of cosmetic and surgical services relative to general dermatology services. While there is no standardization on the mix of dermatology services that NPs and PAs provide, these data may be helpful in framing expectations for productivity and annual compensation.
Decisions about clinical staffing to support any dermatology clinician must be considered in balancing productivity with efficiency, quality patient care, and, of course, practice expenses. The majority of dermatology NPs and PAs who reported seeing 100 to 200 patient visits per week had two or more clinical staff. This information may be helpful for practices when calculating the value of additional support staff to increase NP or PA productivity.
One cannot discuss productivity without exploring the billing practices and revenue generation in a successful dermatology practice. The growing utilization of NPs and PAs in just about every aspect of US healthcare emphasizes evolving trends in billing for their services. Some practices opt to bill incident-to (100% reimbursement) under the physician’s NPI, but they face the challenge of ensuring that all of the stringent criteria have been documented or they risk serious penalties by Medicare. An additional disadvantage of incident-to billing is the value or contributions of NP and PA services may be buried in the physician’s billing. Data from this survey are consistent with healthcare trends indicating that two-thirds of dermatology NPs and PAs bill under their own NPI. Although this results in a lower reimbursement rate of 85 percent, this negates the risk of penalties due to failures to document the Medicare billing guidelines. It also enables practices, patients, and insurers to identify billing under the actual clinician who provided the services. It is concerning that 20 percent of our survey respondents who billed under their NPI were not provided any productivity (billing or revenue) report from their employer.
Clearly, one of the most significant variables influencing compensation is the amount of revenue generated by dermatology NPs and PAs. The majority (77%) of the survey respondents reported their compensation was based on salary plus incentive, percentage of collections, or profit sharing. Yet, it is puzzling how 18 percent of the respondents who have compensation tied to productivity can calculate their compensation if they do not receive a productivity or revenue report.
This survey also identified trends that may suggest potential disparities in compensation related to both gender and professional designation. Clinicians identifying as female comprised the overwhelming majority of the dermatology NP (94%) and PA (80%) respondents. When examining gender within the salary categories, it appears that individuals identifying as male accounted for five percent of the respondents who reported earning less than $100,000 annually. The proportion of male clinicians increased to 33 percent for those who reported earning at least $300,000 annually.
Limitations. This survey sought to identify several workforce characteristics and compensation of dermatology NPs and PAs. Data were limited to those who self-reported, which can result in a response bias. This is the first time dermatology NPs and PAs were surveyed together, which may have influenced their willingness to participate. Given the email-based format of this survey and potential for email inbox fatigue, recipients may have been less inclined to respond. Another reason for the low response rate may be that the survey was distributed by a journal rather than by a professional society. Although the survey was designed to provide a snapshot of workforce characteristics and compensation data, the small number of survey responses (N=180) may limit the generalizability of our findings to the national dermatology NP and PA population. Additionally, responses from survey questions were summarized, but no further analysis was performed to identify underlying reasons for practice trends.
Conclusion
As the utilization of dermatology NPs and PAs increases, so does the need for an enhanced understanding of their workforce characteristics and compensation. This survey sought to improve upon the limited data available and to serve as a resource to dermatology NPs and PAs. These data can prepare dermatology NPs and PAs to engage in thoughtful discussions with their colleagues and employers regarding compensation, professional development, practice expectations, and strategic planning. With this in mind, future studies with larger samples are necessary to gather additional data and build a better understanding of the unique characteristics of dermatology NPs and PAs.
References
- Sargen MR, Shi L, Hooker RS, Chen SC. Future growth of physicians and non-physician providers within the U.S. Dermatology workforce. Dermatol Online J. 2017;23(9):13030/qt840223q6. Published 15 Sep 2017.
- Ehrlich A, Kostecki J, Olkaba H. Trends in dermatology practices and the implications for the workforce. J Am Acad Dermatol. 2017; 77(4): 746–752.
- National Commission on Certification of Physician Assistants (NCCPA). 2020 Statistical Profile of Certified Physician Assistants by Specialty. https://www.nccpa.net/wp-content/uploads/2021/12/2020-Specialty-report-Final.pdf. Accessed 18 Feb 2023.
- National Commission on Certification of Physician Assistants (NCCPA). 2022 Statistical Profile of Certified Physician Assistants by Specialty. https://www.nccpa.net/wp-content/uploads/2022/09/2021-Statistical-Profile-of-Certified-PAs-by-Specialty.pdf. Accessed 18 Feb 2023.
- American Association of Nurse Practitioners (AANP). 2013–2014 National Nurse Practitioner Practice Site Census. Austin, TX. 2015. https://www.aanp.org/images/documents/research/2013-2014national npsensusreport.pdf. Accessed 8 Dec 2022.
- American Association of Nurse Practitioners. 2020 National Nurse Practitioner Sample Survey. 2021. Austin, TX. https://storage.aanp.org/www/documents/no-index/research/2020-NP-Sample-Survey-Report.pdf. Accessed 18 Feb 2023.
- American Association of Nurse Practitioners. NP Fact Sheet. Austin, TX. Updated November 2022. https://www.aanp.org/about/all-about-nps/np-fact-sheet. Accessed 2 Feb 2023.
- Society of Dermatology Physician Assistants. https://doi.org/10.1016/j.jaad.2022.06.1191. Accessed 15 Jan 2023.
- American Association of Nurse Practitioners. 2017 National Nurse Practitioner Sample Survey. Austin, TX. March, 2028. https://storage.aanp.org/www/documents/no-index/research/2017-NP-Sample-Survey-Report.pdf. Accessed 18 Feb 2023.

