Josefina Royo de la torre, MD; Javier Moreno-Moraga, MD; Estefania Muñoz; Paloma Cornejo Navarro, MD
Instituto Médico Laser, Madrid, Spain
Disclosure: The authors report no relevant conflicts of interest.
Abstract
Objective: The objective of this study was to analyze the correlation between degrees of clinical improvement and microscopic changes detected using confocal microscopy at the temperature gradients reached in patients treated for skin laxity with a phase-controlled, multisource radiofrequency system. Design and setting: Patients with skin laxity in the abdominal area were treated in six sessions with radiofrequency (the first 4 sessions were held at 2-week intervals and the 2 remaining sessions at 3-week intervals). Patients attended monitoring at 6, 9, and 12 months. Participants: 33 patients (all women). Measurements: The authors recorded the following: variations in weight, measurements of the contour of the treated area and control area, evaluation of clinical improvement by the clinician and by the patient, images taken using an infrared camera, temperature (before, immediately after, and 20 minutes after the procedure), and confocal microscopy images (before treatment and at 6, 9, and 12 months). The degree of clinical improvement was contrasted by two external observers (clinicians). The procedure was performed using a new phase-controlled, multipolar radiofrequency system. Results: The results reveal a greater degree of clinical improvement in patients with surface temperature increases greater than 11.5ºC at the end of the procedure and remaining greater than 4.5ºC 20 minutes later. These changes induced by radiofrequency were contrasted with the structural improvements observed at the dermal-epidermal junction using confocal microscopy. Changes are more intense and are statistically correlated with patients who show a greater degree of improvement and have higher temperature gradients at the end of the procedure and 20 minutes later. Conclusion: Monitoring and the use of parameters to evaluate end-point values in skin quality treatment by multisource, phased-controlled radiofrequency can help optimize aesthetic outcome. (J Clin Aesthet Dermatol. 2011;4(1):28–35.)
Skin laxity is an aesthetic problem that occurs between the ages of 35 and 40 years, although it generally starts to become visible from age 40 onward. Problems with skin laxity and quality also start to appear in younger people as a consequence of pregnancy or sudden weight loss. The impact of these problems on the patient’s self-esteem can become important enough to affect quality of life in psychological and in sociocultural terms.[1,2] The demand for treatment of skin laxity is growing as the conventions of beauty become increasingly demanding.
Laxity is a skin disorder that occurs with natural or accelerated aging and is structurally linked to diminished collagen production. The number and vitality of fibroblasts decrease, and both the dermis and the fibrous septa undergo partial loss of their natural ability to replace themselves. The morphological changes that appear are a consequence of diminished biosynthesis of collagen and elastin and abnormalities of the extracellular environment with a decrease in the concentration of hyaluronic acid.[3] It occurs early on the inner arms and legs and on the abdominal area. Skin laxity is associated with lack of physical exercise, rigorous dieting, and other causes and it often appears in combination with cellulite. Cellulite is an inflammation of the subcutaneous adipose tissue and has several causes. It occurs mainly on the legs, buttocks, hips, breasts, arms, and neck.[4] Depending on the pathogenic mechanism, it is classed as dermopanniculosis deformans, adiposis edematosa, or gynoid lipodystrophy.[5–9] The fibrous structure of the interlobular septa that divide female subcutaneous cell tissue into compartments is arranged perpendicular to the skin surface. This structure enables fat lobules in each septum to move toward the skin surface, which is the only structure that contains them. Some authors consider that cellulite visible to the naked eye is caused by lengthening and weakening of connective tissue fibers accompanied by fat protrusion.[10–11]
Radiofrequency is useful in treating skin laxity. Heat-induced behavior of connective tissue and the degree of contraction achieved depend on factors such as the highest temperature reached (peak temperature), duration of exposure to radiofrequency, and the mechanical stress applied to tissue during the heating process. The thermal properties of tissue can also vary depending on skin quality, age, pH, electrolyte concentration, orientation and concentration of collagen fibers, and levels of tissue hydration. Treatment involves increasing tissue temperature to between 55ºC and 62ºC so that local vasodilatation is triggered and new collagen is formed.[12–16]
The authors have clinical experience with different radiofrequency systems (monopolar and bipolar), either alone or in combination with vacuum and infrared systems that have been analyzed in several published clinical trials.[15–19] Their results have varied, ranging from excellent on occasion to very poor or ineffective. In this study, the authors used a phase-controlled, multisource radio-frequency system (EndyMed PRO™, EndyMed Medical, Caesarea, Israel). This system allows the user to confine the emission of energy to a depth of up to 11mm and makes it possible to apply concentrated heat to the papillary dermis, reticular dermis, and fascia superficialis. The authors also searched for clinical references and performed a histological verification of the efficacy of the treatment in order to improve the results. They analyzed subjective and objective levels of improvement and their relationship with temperature modifications as well as the histological changes observed with confocal laser scanning microscopy (CLSM).
This clinical study was carried out according to the ethical principles of the declaration of Helsinki and the guidelines for Good Clinical Practice. The authors had no affiliation with or financial involvement in any organization or entity with a direct financial interest in the subject matter or materials discussed in the manuscript.
Materials and Methods
Subjects. The study population comprised 33 healthy patients (all women) with skin laxity on the abdominal area and a mean (±SD) age of 44.2±13.6 years.
Inclusion criteria. All patients had skin laxity on the abdominal area. They also had to be older than 25 years, give their informed consent, and agree to undergo a complete clinical follow up.
Exclusion criteria. Patients were excluded for the following reasons: presence of a pacemaker, metallic implants in the treatment area, medication regimen that alters the cutaneous response (e.g., retinoic acid), invasive intervention in the treatment area during the previous six months, noninvasive intervention in the treatment area (e.g., depilation or other medical-aesthetic procedures) during the previous six months, weight loss (dieting), suspicious cutaneous lesions, history of keloids or hypertrophic scarring, pregnancy or breastfeeding, epilepsy or severe migraines, infection, pain or abscess in the treatment area, presence of tattoos or body piercing in the treatment area, autoimmune disorders or diabetes, eczema or dermatitis in the treatment area, anticoagulant therapy, or clinician-based exclusion criteria.
Treatment protocol. All of the patients received six sessions; the first four treatments were performed every two weeks and the last two treatments every three weeks. At all sessions, the authors recorded the following data: weight, measurement of the contour of the area to be treated at a preset height measurement, and measurement of the untreated control area. The different levels at which the abdominal circumference is measured can lead to errors in data recording. Therefore, in each case, the authors recorded the height (distance from the floor) at which the abdominal circumference and control area were first measured, to ensure that they were always taken from the same point.
The authors also recorded the evaluation of the degree of skin laxity by the clinician and by an external assessor, thermographic images and temperature of the treated area (before, immediately after, and 20 minutes after treatment), total energy used for each square of skin treated, CLSM images (before the first session), and side effects. A photograph of the area also was taken. Similarly, patients were asked to subjectively evaluate the degree of improvement from the second session onward. Patients were asked to evaluate the degree of pain according to a visual analog scale. All sessions were held and data recorded in a room with a stable temperature of 24ºC.
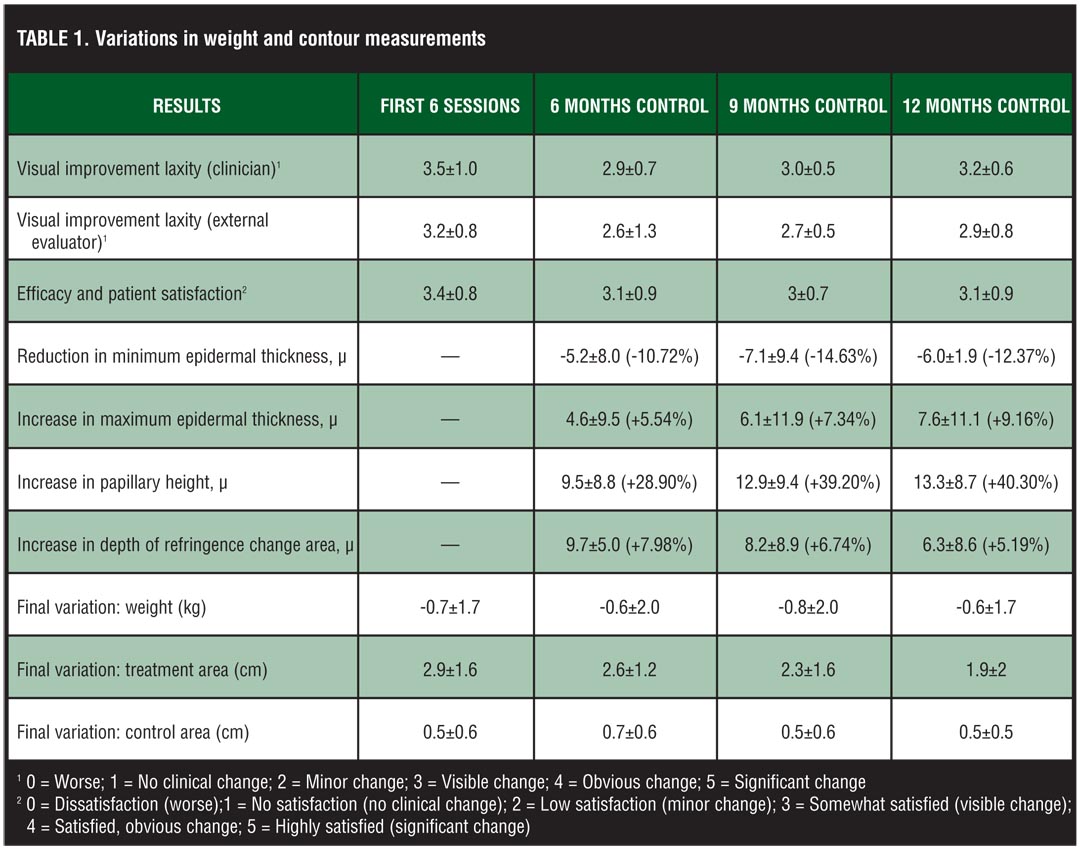
Patients returned at 6, 9, and 12 months after the sessions to record weight, measure the contour of the area to be treated at a preset height, measure the untreated control area, and evaluate the degree of skin laxity by the clinician and an external assessor. CLSM images and photographs of the treated area were taken. Patients were asked to evaluate the degree of improvement (Table 1 and Table 2).
Devices. The radiofrequency device used was an EndyMed PRO™, a phase-controlled, multisource radiofrequency system that emits at 1MHz at 1 to 65 watts. The confocal laser scanner microscope used was the VivaScope 1500 (Lucid Inc., Rochester, New York). The infrared camera used was the Flir i7 (FLIR Systems), and the infrared thermometer used was the CEM DT-880B.
Technique. All abdominal areas were drawn and divided into 100cm2 rectangles or squares. The average number of squares/rectangles in each area was five. The squares/rectangles were drawn with a 20-percent overlap to avoid untreated areas (cold spots) and to ensure that the whole area was heated. Sufficient sweeps were made to complete the pretherapeutic (preheating) stage in which the surface temperature must reach 40 to 42ºC.[14–19]
Once the pretherapeutic temperature was reached, each session involved 8 X 30-second sweeps, with breaks of two seconds between each sweep. In order to prevent hot spots, the sweeps were made following the same protocol in all the squares/rectangles, at all the sessions, and for all the patients:
First sweep—circular movement from inside to outside the square/rectangle;
Second sweep—circular movement from outside to inside the square/rectangle;
Third sweep—horizontal movement starting the square/rectangle at the top;
Fourth sweep—vertical movement from left to right in each square/rectangle;
Fifth sweep—circular movement from inside to outside the square/rectangle;
Sixth sweep—circular movement from outside to inside square/rectangle;
Seventh sweep—horizontal movement starting the square/rectangle at the bottom;
Eighth sweep—vertical movement from right to left in each square/rectangle.
Contact between the skin and the handpiece was improved by applying a fine layer of tepid ultrasound gel (30ºC). During the first session, preheating emission power was optimized by recording the maximum power tolerated by the patient continuously over the 100cm2 area for 120 seconds (4 uninterrupted sweeps) starting from a base power of 45W. The value obtained was recorded as a reference for subsequent sessions. Once 40 to 42ºC was reached, the therapeutic phase began.
Attempting to avoid interrupting sweeps was essential as sweeps intervals greater than 5 seconds decreased the surface temperature by 2 to 3ºC. When necessary, power was reduced in steps of 2W and more warm contact gel (30ºC) was added to prevent the grid from cooling. The operation was repeated in the neighboring grids until the area was completely treated.
During all sessions, images were recorded using an infrared camera to ensure that the whole area was evenly heated. In each square, temperature was measured before the start of the pretherapy phase (T0), immediately after the sweeps were completed (TF), and after 20 minutes (T20).
Thermographic images were captured using a Flir i7 infrared camera prepared for capture perpendicular to the skin surface. This thermal imaging camera has a meter that measures the distance between the camera and the surface to be photographed. All the images were captured at a distance of 25cm. The maximum temperature was recorded on the image captured. The images captured were stored on the follow-up form for each patient. The maximum temperature values for each image were included in the statistical analysis.
Results. Mean tolerated power was 40±7W. Mean variation in weight during treatment was –0.7±1.7kg after six sessions and –0.6±1.7 at the 12-month checkup. Mean reduction in the contour of the treatment area after the first six sessions was –2.9±1.6cm, which stabilized after 12 months at –1.9±2.0cm. There were no significant differences in the variation of the contour of the control area (–0.5±0.6cm after 6 sessions and –0.5±0.5cm at the 12-month visit) (Table1).
Both the attending physician and an external observer evaluated the degree of clinical improvement in laxity according to the following scale (0=worse; 1=no clinical change; 2=minor change; 3=visible change; 4=obvious change; 5=significant change). The patient made an objective evaluation using a similar scale—the Global Aesthetic Improvement Scale (0=dissatisfaction, worse; 1=no satisfaction, no clinical change; 2=low satisfaction, minor change; 3=somewhat satisfied, visible change; 4=satisfied, obvious change; 5=highly satisfied, significant change) (Table 1).
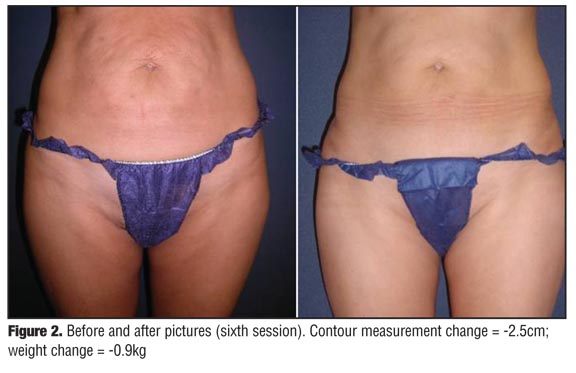
The clinician’s evaluation of laxity after six sessions was initially 3.5±1.0 degrees (improved–much improved); at 12 months, this was 3.2±0.6. The external observer recorded values that were a few tenths below those of the attending physician (3.2±0.8 after 6 sessions and 2.9±0.8 at 12 months). The degree of efficacy and patient satisfaction was initially 3.4±0.8 degrees out of 5, and 3.1±0.9 at 12 months (Table 1, Figure 1 and Figure 2).
The mean measurements taken using CLSM were as follows:
1. Minimum epidermal thickness (Emin). This is determined by the tip of the uppermost papillae. Emin would be defined as the maximum depth at which only the cellular structure of the epidermis contributes to the signal. Reduction in minimal epidermal thickness was –5.2±8.0µ at six months; –7.1±9.4 at nine months with –6.0±11.9µ at the 12-month visit (–10.72%, –14.63%, and –12.37%, respectively).
2. Maximum epidermal thickness (Emax). This is defined by the valley of the papillae. The different optical properties of the cellular structure in the epidermis and fibrous structure in the dermis cause a change in the slopes in the reflected intensity profile of images. The onset of this change in a slope at Emax corresponds to the depth at which a cellular structure is no longer observed in the image stack upon going from the surface to deeper positions. Increase in maximum epidermal thickness was 4.6±9.5µ at six months, 6.1±11.9µ at nine months with an increase to 7.6±11.1µ at the 12-month checkup (5.54%, 7.34% and 9.16%, respectively).
3. Dermo-epidermal junction. Determination of Emax-Emin makes it possible to calculate the thickness of the dermo-epidermal junction (papillary height). Increase in papilla height of 9.5±8.8µ at six months, 12.9±4µ at nine months, which increased gradually to 13.3±8.7µ at the 12-month visit (28.79%, 39.20% and 40.30%, respectively).
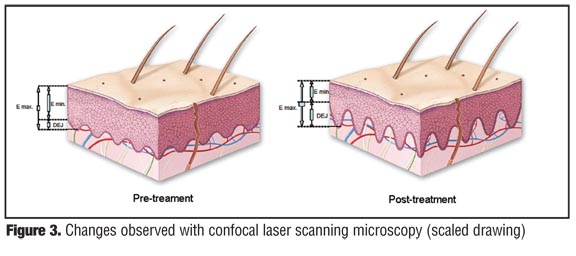
4. Upper dermis. At a certain depth, a reflecting layer of fibrous structure in the upper dermis (UD) is observed in the stacks. The location of this reflecting layer was defined as UDmin + UDmax/2, where UDmin is the location of the onset of this layer and UDmax the location of its maximum intensity. The refringence band (UD) of the reticular dermal collagen was located deeper: +9.7±5.0µ at six months, +8.2±8.9µ at nine months, and this fell partially to +6.3±8.6µ at the 12-month visit (+7.98%, +6.74%, and +5.19%, respectively) (Table 1 and Figure 3).
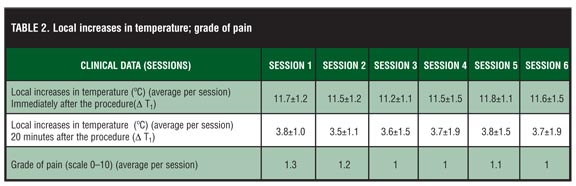
The mean degree of pain reported by the patients was low—1.1 on a scale of 1 to 10 (Table 2). There were no side effects. The mean increase in temperature (ºC) of each grid was as follows: first session, 11.7±2 immediately after the procedure and 3.8±1 after 20 minutes; second session, 11.5±2 and 3.5±1; third session, 11.2±1.1 and 3.6±1.5; fourth session, 11.5±1.5 and 3.7±1.9; fifth session, 11.8±1.1 and 3.8±1.5; last session, 11.6±1.5 and 3.7±1.9 (Table 2).
Statistical analysis. Qualitative variables were divided into categories and quantitative variables into intervals. Age was separated in intervals by grouping the same number of patients per group starting with patients under 25 years of age and increasing to 66 years of age. Once the variables were divided, the authors calculated the mean of each category or interval in order to have a representative value for each of them and to compare them with each other by observing how they behaved with the remaining variables. The authors correlated clinician evaluation and external observer variation (improvement in laxity), patient satisfaction (efficacy/patient satisfaction), CLSM values (maximum epidermal thickness, minimum epidermal thickness, papillary height, and change in the refringence area), and temperatures. Temperatures of the session were evaluated as follows: increase in temperature immediately after the session (D T1 = T0–TF) and increase after 20 minutes (D T2 = T0–T20). The most significant statistical results were as follows:
Age. Younger age was positively correlated with good results (Pearson P: p=0.586, a=0.003).
Increase in final temperature (D T1). The clinical results clearly showed a greater degree of improvement in laxity when the final temperature was higher. Increases in final temperature (D T1) greater than 11.5ºC were positively correlated with a greater degree of improve-ment (p=0.677, a=0.000).
Increase in temperature at 20 minutes (D T2). The evaluation from patient, clinician, and external observers were better at higher temperatures after 20 minutes. Increases in temperature at 20 minutes (D T2) >4.5ºC (p=0.802, a=0.002) are associated with the best results. The values for the two temperature variables (D T1 and D T2) were positively correlated (p=0.773, a=0.003).
Changes with CLSM. The association between the degree of clinical improvement and histological improvement observed with CLSM was considerable (p=-0.860, a=0.005). The presence of more intense morphological changes, as measured using CLSM, was strongly correlated with increases in final temperature (D T1) greater than 11.5ºC (p=0.812, a=0.002) and with increases in temperature at 20 minutes (D T2) >4.5ºC (p=0.723, a=0.009).
Discussion
Radiofrequency is a widely accepted treatment for skin laxity, thanks to the increased tissue temperature and the subsequent reparative reaction it generates.[19–24] Temperature gradients generated by radiofrequency vary from patient to patient, as does the gradient necessary to induce the repair response and its intensity.
The target of this clinical study was to attempt to find a statistically significant association between tissue response and final skin temperatures. We found that increases over baseline greater than 11.5ºC (D T1) and increases at 20 minutes (D T2) greater than 4.5ºC were associated with better results.
In the authors’ experience, it is not always easy to reach these gradients. In fact, the sudden heat that is sometimes observed produces a burning sensation (heat peaks) that reduces the patient’s tolerance and makes it necessary to stop the procedure; this results in a sharp fall in skin temperature (2–3ºC in 5 seconds). The design of the handpiece and its large contact area make it much easier to prevent heat peaks and therefore improve the patient’s tolerance. The three pairs of electrodes generate electrical fields with equal polarity as a result of the system’s synchronized phased energy emission. As “like” poles repel, currents can run in deeper planes[25] using bipolar radiofrequency. Very little current flows on the skin surface, which may also be a reason for the patient’s better pain tolerance. Progressive, better-distributed heating facilitates a larger number of sweeps and greater tissue heating. Overlapping of heat in neighboring areas allows all the tissue treated to function as a relative heat reservoir, with the result that neighboring grids require fewer sweeps for preheating.
Clinical improvement in laxity is difficult to measure[25]; therefore, a correlation was attempted to be established through objective histological changes using real-time CSLM. This works by detecting the photon refraction that occurs in illuminated live tissue with an 834nm diode laser. The lateral measurement resolution of the system used is 0.5 to 1µ and the optical thickness of 2 to 5µ can be compared to that of conventional histology.[26]
Contrast of confocal images is obtained by the different refraction indices of the organelles and other structures of pigmented epithelia.[27–29] Current technology enables us to obtain images up to a depth of 250 to 350µ, including the epidermis, papillary dermis, and the most superficial part of the reticular dermis.[26]
The Vivascope 1000 generates and measures images parallel to the skin surface. The software included enables the system to run in high definition, both for capture and for analysis of images. Images are captured in parallel to the surface of the skin in very adjusted axial steps (2µ in depth), that is, every image is scanned at depths that increase every 2µ, with the result that 100 images represents a depth of 200µ. The system takes 20 seconds to carry out this analysis.
The images are stored for subsequent analysis. In order to ensure that the images were captured at the same point, the area was marked and the location photographed; the same area was marked for each subsequent image capture. Ten captures were made at each point to avoid variability. The values in the table are average values.
The system is equipped with a mechanical positioner (Physik Instrumente 50) installed on the mount of the camera lens. The pressure generated by the camera-positioning arm on the skin is always the same; therefore, the thickness of the skin is not altered by the pressure.
Given the limits of depth, the authors defined four parameters to measure the potential morphological changes in the dermal-epidermal junction: D Emin (minimum epidermal thickness), D Emax (maximum epidermal thickness), D DEJ thickness (papillary height), and D UD (depth of the reticular collagen refringence band).[30,31]
Minimum epidermal thickness D Emin—measurement of epidermal thickness taken from the skin surface (stratum corneum) to the point where the first peaks of the dermal papillae become visible. The distance between the surface and the dermal crest increases with age: 50±8µ in patients over 65 years of age compared with 47±5µ in patients under 25 years of age.
Maximum epidermal thickness D Emax—measurement of epidermal thickness taken from the skin surface (stratum corneum) to the depth at which a cellular is no longer observed (epidermal thickness up to the dermal valley). Maximum epidermal thickness decreases with age: 75±7µ in patients over 65 years of age compared with 89±8µ in patients under 25 years of age.
D DEJ thickness (papillary height). The determination of Emax–Emin makes it possible to calculate the thickness of the dermo-epidermal junction (papillary height). An increase in the thickness of the dermo-epidermal junction is one of the main differences between young skin and mature skin: 25±8µ in patients over 65 years of age compared with 41±8µ in patients under 25 years of age. Mature skin undergoes flattening of the dermo-epidermal junction as a result of flattening of the papillae. Depending on image depth, the confluence of papillae can be observed in skin affected by elastosis.
Depth of the reticular collagen refringence band. At a certain depth (110–140µ), a reflecting layer of fibrous structure in the upper dermis is observed in the stacks. The location of this reflecting layer (UD) is lower in mature skin: 107±8µ in patients over 65 years of age compared with 136±10µ in those under 25 years of age.
The increase in the depth of the refringence band after treatment is also a sign of dermal structural improvement.
Furthermore, in thin skin, the morphology of dermal collagen can be observed accurately up to 200µ. Young collagen is arranged in the form of fine even mesh with structures and is made up of narrower diameter fibers than older collagen, which is arranged irregularly and in the form of clusters (elastosis). A reduction in the larger diameter of collagen fibers represents a structural improvement in dermal collagen.[30–32]
We observed histological changes that reflect structural improvement in the dermis; the most significant absolute values of change, as observed by CLSM, were for the increase in papillary height (28.90% at 6 months and 40.30% at 12 months). This is a considerable improvement in the quality of the dermo-epidermal junction and is consistent with the results of other clinical studies based on conventional histology. The increased depth of the collagen refringence band (9.7±5.0 [9.7%] at 6 months and 6.3±8.6 [5.19%] at 12 months) points to the existence of long-term collagen remodeling.[31–34] Despite the high degrees of temperature obtained in several patients, there were no side effects.
While it is difficult to quantify the peak temperature increase that can lead to improved skin quality in an individual patient, the relationship between the highest degrees of clinical improvement, histological changes, and D T1 >11.5ºC and D T2 >4.5ºC seem to indicate that some temperature gradients induce a more favorable tissue response.
Conclusion
Radiofrequency skin treatments, in this study, show a statistically significant association between better results at increases in end temperature D T1 >11.5ºC and increases in temperature at 20 minutes D T2 >4.5ºC. These gradients are in turn significantly associated with higher indices of structural improvement, as seen using CLSM.
References
1. Sarwer DB, Magge L, Clark V. Physical appearance and cosmetic medical treatments: physiological and sociocultural influences. J Cosmet Dermatol. 2003;2:29–39.
2. Hexsel D, de Oliveira Dal’Forno T, Cignachi S. Social impact of cellulite and its impact on quality of life. In: Goldman MP, Bacci PA, Leibaschoff G, Hexsel D, Angelini F, eds. Cellulite: Pathophysiology and Treatment. New York: Taylor & Francis; 2006:1–5.
3. Uitto J. The role of elastin and collagen in cutaneous aging: intrinsic aging versus photoexposure. J Drugs Dermatol. 2008;7(2 Suppl):S12–S16.
4. Avram MM, Avram AS, James WD. Subcutaneous fat in normal and diseased states: 1. Introduction. J Am Acad Dermatol. 2005;53(84)9:663–670.
5. Curry SB, Ryan TJ. Panniculopathy and fibrosclerosis of the female breast and tightening. In: Ryan TJ, Curri SB, eds. Cutaneous Adipose Tissue. Philadelphia: Lippincott; 1989:107–119.
6. Curri SB. Las paniculopatías de estasis venosa: diagnóstico clínico e instrumental. Hausmann, Barcelona; 1991.
7. Rossi AB, Vergnanini AL. Cellulite: a review. J Eur Acad Dermatol Venereol. 2000;14(4):251–262.
8. Smith WP. Cellulite treatments: snake oils or skin science. Cosm Toil. 1995;1(10):61–70.
9. Querleux, Cornillon C, Joliven O, Bittoun DJ. Skin research technology anatomy and physiology of subcutaneous adipose tissue by in-vivo magnetic resonance imaging and spectroscopy: relationships with sex and presence of cellulitis B. Skin Research & Technology. 2002:8:118–124.
10. Nürnberger F, Müller G. So-called cellulite, an invented disease. J Dermatol Surg Oncol. 1978;4:221–229.
11. Piérard GE, Nizet JL, Piérard-Franchimont C. Cellulite from standing fat herniation to hypodermal stretch marks. Am J Dermatopathol. 2000;22:34–37.
12. Arnoczky SP, Aksan A. Thermal modification of connective tissue. Basic science considerations and clinical impressions. J Am Acad Orthop Surg. 2000,8:305–313.
13. Dierickx C. The role of deep heating for non-invasive skin rejuvenation. Lasers Surg Med. 2006;38:799–807.
14. Sadick NS, MakinoY. Selective electro-thermolysis in aesthetic medicine: a review. Lasers Surg Med. 2004;34: 91–97.
15. Sadick NS, Mulholland RS. A prospective clinical study to evaluate the efficacy and safety of cellulite treatment using the combination of optical and RF energies for subcutaneous tissue heating. J Cosmet Laser Ther. 2004;6: 187–190.
16. Childs JJ, Smirnovs M, Zelenchuk A, Alshueler G. Semi-automated method of analysis of horizontal histological sections of skin for objetive evaluation of fractional devices. Lasers Surg Med. 2009;41:634–642.
17. Franco W, Kothare A, Goldberg DJ. Controlled volumetric heating of subcutaneos adipose tissue using a novel radiofrequency technology. Lasers Surg Med. 2009;41: 745–750.
18. Brigthtman L, Weiss E, Chapas AM, et al. Improvement in arm and post-partum abdominal and flank subcutaneous fat deposits and kin laxity using a bipolar radiofrecuency, infrared, vacuum and mechanical massage device. Lasers Surg Med. 2009;40:791–798.
19. Nootheti PK, Magpantay A, Yosowitz G, Calderon S, Goldman M. A single-center, randomized, comparative prospective clinical study to determine the efficacy of the Velasmooth System versus the Triactive System for the treatment of cellulite. Lasers Surg Med. 2006;38(10):908–912.
20. Yoshimune K, Yoshimura T, Nakayama T, Nishino T, Esaki N. Hsc62, Hsc56, and GrpE, the third Hsp70 chaperone system of Escherichia coli. Biochem Biophys Res Commun. 2002;293(5):1389–1395.
21. Tavaria M, Gabriele T, Kola I, Anderson RL. A hitchhiker’s guide to the human Hsp70 family. Cell Stress Chaperones. 1996;(1):23–28.
22. Zelickson BD, Kist D, Bernstein E, et al. Histological and ultrastructural evaluation of the effects of a radiofrequency-based nonablative dermal remodeling device. A pilot study. Arch Dermatol. 2004;140:204–209.
23. Kawada N, Kuroki T, Kowasky K, et al. Expression of HSP 47 in mousse liver. Cell Tissue Rest. 1996;288:341–346.
24. del Pino E, Rosado RH. Effect of controlled volumetric tissue heating with radiofrequency on cellutis and the subcutaneous tissue of the buttocks and thighs. J Drugs Dermatol. 2006;5(8):714–722.
25. Ellman M, Vider I, Harth Y, Gottfried V, Shemer A. Noninvasive therapy of wrinkles and lax skin using a novel multisource phase-controlled radiofrequency system. J Cosmet Laser Ther. 2010;12:81–86.
26. Huzaira M, Rius F, Rajadhyaksha M, Anderson RR, González S. Topographic variations in normal skin, as viewed by in-vivo reflectance confocal microscopy. J Invest Dermatol. 2001;116(6):846–852.
27. Rajadhyaskhsa M, Grossman M, Esterowitz D, Webb RH, Anderson RR. In-vivo confocal scanning laser microscopy of human skin: melanin provides a good contrast. J Invest Dermatol. 1995;104:946–952.
28. Gonzalez S, Rajadhayaksha M, Rubinstein G, Anderson RR. Characterization of psoriasis in vivo by reflectance confocal microcopy. J Invest Dermatol. 1998;111:538–539.
29. Gonzalez S, Rajadhayaksha M, Gonzalez-Serva A, White WM, Anderson RR. Confocal reflectance imaging of folliculitis in vivo; correlation with routine histology. J Cutan Pathol. 1999;26:201–205.
30. Sauermann K, Clemann S, Sören J, et al. Age related changes of human skin investigated with histometric measurements by confocal laser scanning microscopy in vivo. Skin Res Technol. 2002;8:52–56.
31. Neerken S, Lucassen GW, Bisschop MA, Lenderink E, Nuijs TA. Characterization of age-related effects in human skin: a comparative study that applies confocal laser scanning microscopy and optical coherence tomography. J Biomed Opt. 2004;9(2):274–281.
32. Rajadhayaksha M, Gonzalez S, Zavislan JM, et al. In-vivo confocal scanning laser microscopy of human skin II: advances in instrumentation and comparision with histology. J Invest Dermatol. 1999;113:293–303.
33. Arnoczhy SP, Aksan A. Thermal modification of connective tissues: basic science considerations and clinical implications. J Am Acad Orthop Surg. 2000;8:305–313.
34. Kaplan H, Gat A. Clinical and histopathological results following Tripolar radiofrequency skin treatments. J Cosmet Laser Ther. 2009;11:78–84.