
Joel Schlessinger, MD, FAAD, FAACS; Daniel Schlessinger; Bernard Schlessinger, PhD
Advanced Skin Research Center, Omaha, Nebraska
Disclosure: Dr. Joel Schlessinger is a researcher for Medicis, Allergan, Merz, and Mentor. Daniel Schlessinger and Dr. Bernard Schlessinger report no relevant conflicts of interest.
Abstract
Objectives: The authors sought to examine and assess cosmetic surgery patient demographics as well as age in relation to partner, in a prospective manner, analyzing data for any significant correlations. Design: The authors conducted a prospective study utilizing a survey. Setting: The study was conducted in a private, nonacademic dermatological practice. Participants: Three hundred thirty-six patients participated in this study. Results: Demographics of onabotulinumtoxinA/abobotulinumtoxinA (neurotoxins), fillers, and laser hair removal users were studied. The data show that the average private practice cosmetic surgery patient in this study is a married (67.5%), college-educated or greater (66.9%), employed (74.3%), mother (74.5%). In the fillers category, 50 percent of women were older than their partners, as opposed to 14.8 percent in 2008 Census data. Additionally, women were more educated and employed to a higher percentage than similar women in 2008 Census data. Data on motivations were statistically not significant. Conclusion: Data from this study show potential correlations with Census data norms in marital status and motherhood status categories, but not in the age in relation to partner, education, and employment level categories. Motivations of individuals undergoing cosmetic surgery will need further analysis in future studies.
(J Clin Aesthet Dermatol. 2010;3(11):30–35.)
The purpose of this study was to prospectively determine demographics and motivations of cosmetic surgery patients in a nonacademic, cosmetic surgery practice setting. A number of variables were studied, including gender, age, and reasons for cosmetic surgery. The relationship of age to partner’s age, education, job status, and marital/motherhood status were surveyed as well.
The authors note that while many studies or “phone surveys” and e-mail questionnaires have retrospectively surveyed the number of persons who elect or would elect to have cosmetic surgery, this survey studied the actual demographics of cosmetic surgery patients in a prospective manner.[1–8] While these statistics have been incorporated into data provided to journalists, the lay public, and physicians, the accuracy of the results is questionable. Lastly, many national organizations collect “end of the year” data from cosmetic surgeons that are, again, retrospective and are not conducted with the same rigor used in this study.
There are numerous references in the common literature and film/TV/online forums regarding exactly who is the “typical” cosmetic surgery patient.[9–11] Additionally, there are frequent assumptions made regarding who is the “typical” cosmetic surgery patient, particularly the concept of an older woman partnered with a younger man and younger woman partnered with an older man with relation to cosmetic surgery.[12,13] No study to date has actually tabulated results regarding these associations.
The results of this study could be helpful in determining needs and motivations among private practice patients. Additionally, it could assist in marketing strategies for both physicians and companies with cosmetic products.
Methodology
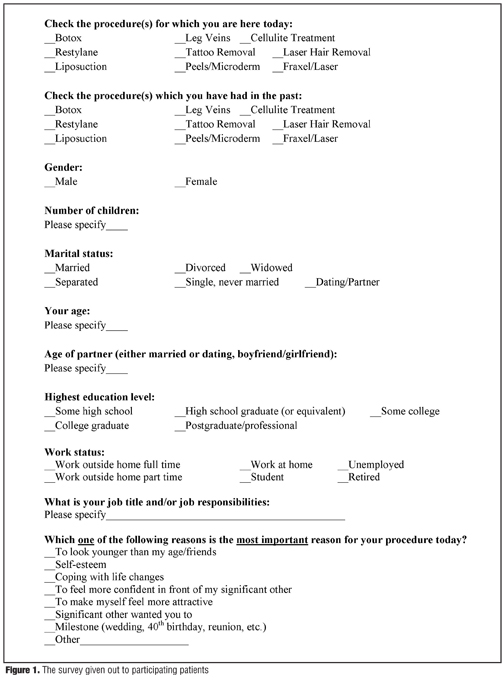
The study employed an anonymous questionnaire method. Surveys were handed out to patients prior to the performance of the cosmetic procedure, and patients were allowed to choose whether they would participate. No names were required on the questionnaires, which were distributed by either the patient coordinator or a nurse. All patients receiving one or more of the following pro- cedures were given the opportunity to participate: onabotulinumtoxinA/abobotulinumtoxinA (neurotoxins), fillers, liposuction, sclerotherapy, tattoo removal, peels/microdermabrasion, cellulite treatment, laser hair removal, or fractionated CO2 laser devices. The study took place in a private, nonacademic, dermatological practice in Omaha, Nebraska, beginning in late April 2009 and ending seven months later. Four hundred surveys were handed out, and 336 surveys were returned. Twenty subjects were found not to be users of the procedures included and were eliminated from the study. One subject reported being a user of all three considered procedures and was included as part of the “Neurotoxins and Fillers Users” group. Remaining subjects were classified into four groups: Neurotoxins Users (no fillers) (n=128), Fillers Users (no neurotoxins) (n=31), Neurotoxins and Fillers Users (n=91), and Laser Hair Removal Users (no neurotoxins or fillers) (n=66). Results were determined for the entire population (n=316) and for the female subgroup (n=302). The questionnaire used in the study is shown in Figure 1.
Results
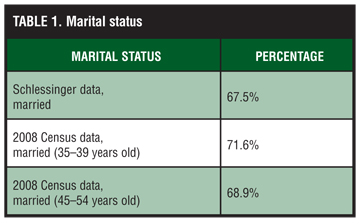
The results for the total subjects (n=316) were not statistically different from the results of the female only subjects (n=302); therefore, they are not presented or analyzed separately. All the following results are for female subjects only. It is interesting to note that in this practice, for this study, 95.6 percent of the subjects were women. In the literature, the percentage of women patients seeking cosmetic surgery is around 85.7 percent.[14] This study’s data showed that 67.5 percent of the women were married, which is close to the 2008 Census data for 45- to 54-year-old women of which 68.9 percent were married.[15]
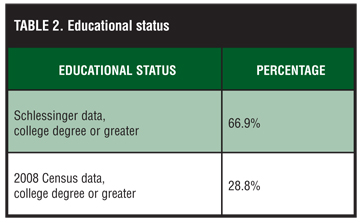
This study showed that 66.9 percent of women who received cosmetic surgery had a college degree or greater. Comparatively, 2008 Census data shows that only 28.8 percent of women in the United States earned a college degree or more.[16] A 2007 report of the American Society of Plastic Surgeons (ASPS) echoes the findings of the Census, reporting that 28 percent of patients have a college degree or greater.[17] The patients in the Schlessinger study were obtaining noninvasive cosmetic surgery procedures, in contra-distinction to the ASPS survey, which interviewed essentially the same population size but for procedures under general anesthesia. This may account for the differences.
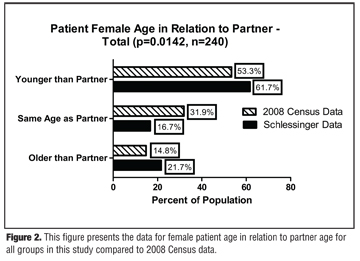
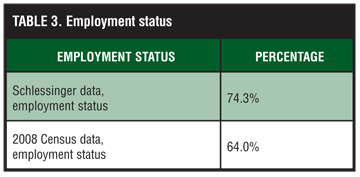
This study’s results showed that 74.3 percent of women were employed. In contrast, 2008 Census data show that of 121 million women in the United States, 64 percent were employed.[18] The data from this study were analyzed additionally by age groups, which revealed an interesting trend. Figure 2 presents the data for female patient age in relation to partner age for all groups in this study compared to 2008 Census data. Women who are older than their partners were significantly overrepresented in the group seeking cosmetic surgery. Those who are younger than their partners were slightly overrepresented and those who are the same age as their partners were significantly less represented. What this data seem to indicate is that the preponderance of women seeking cosmetic surgery falls into two distinct groups: those who are older or those who are younger than their partner. Those who are the same age as their partner seek cosmetic surgery less often.
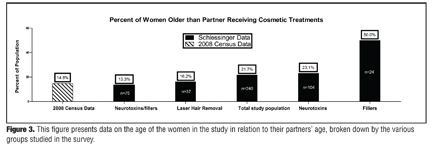
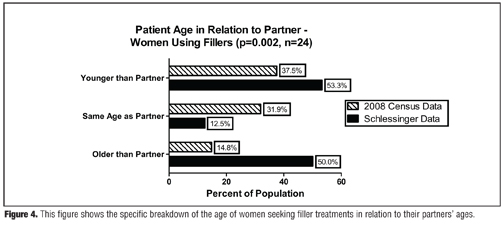
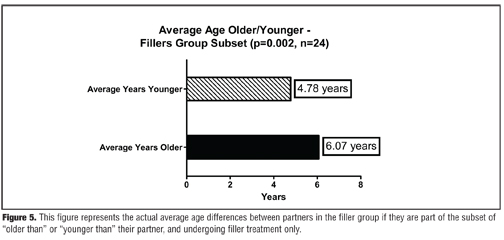
Figure 3 presents data on the age of the women in the study in relation to their partners’ age, broken down by the various groups studied in the survey. In all groups, the women who are older than their partners were overrepresented in those seeking cosmetic surgery (n=240, p=0.0142). This is startlingly true for those seeking filler treatments (p=0.0020), and true as well for those seeking laser hair removal, neurotoxins, and the total representation. The average age difference among women in the filler group is 6.07 years older than their partners (Figure 4 and Figure 5).
Overall, this data can be compared to 2008 Census data, which show that the percent of women who are older than their partners is 14.8 percent (no age-association data are given). It should be noted that, in this study, not all women had partners. For those who did, overall (n=240), 148 (61.7%) were younger than their partners, 52 (21.7%) were older than their partners, and 40 (16.7%) were the same age as their partners.
The “Neurotoxins and Fillers” group (both used together) did not reflect the age disparity correlation. This may reflect a universal trend among women seeking these procedures.
Discussion
The results of this study are interesting in that they represent the first prospective analysis of cosmetic surgery patient demographics. Every study to date in the literature has been based upon data retrospectively gathered by corporations or cosmetic surgeons rather than directly from patients in a true survey methodology. This study is the first to tabulate patient data and patient responses to questions including age, age of partner, educational status, employment status, marital status, number of children, and motivation for procedure with subsequent analysis (Table 1, Table 2, Table 3, Table 4).
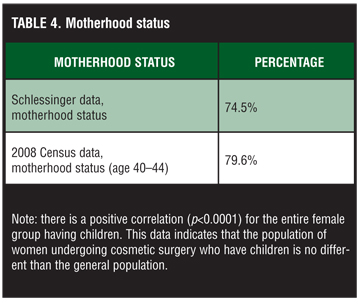
The data show that the average private-practice, cosmetic surgery patient is a married (67.5%), college-educated (66.9%), employed (74.3%), mother (74.5%). Statistics regarding marital status and motherhood status are fairly similar to what is found in the overall population, an interesting finding in itself. Employment, at approximately 10-percent higher than the normal population, is slightly different, and educational level, at approximately 40-percent higher than the normal population, is significantly different. The prevalence of higher employment may reflect a greater ability to access cosmetic surgery procedures, as would higher educational levels. These data can be used to educate physicians about prospective clients and marketing strategies for these clients. It can also be used to pinpoint future groups that will be more receptive to cosmetic procedures.
While age is frequently a motivation for cosmetic surgery, the quantification of exact ages of cosmetic surgery patients in relation to their partners could have implications for future studies. This is the first time that the correlation of age differences of partners to cosmetic surgery utilization has been studied. This finding is interesting because it is different from the norm in the entire population. This study showed that there are two significant subsets of patients represented with respect to partners: those who are older than their partners and those who are younger than their partners. Those who are the same age as their partners represent only 16.7 percent of all cosmetic surgery patients. The average age difference in the fillers users population for the “older than partners” group was 6.1 years older than partner (50.0%) versus 4.8 years younger than partner (37.5%) for the “younger than partners” group. The “older than partners” and “younger than partners” groups are higher than the latest Census data figures.
These populations are generally difficult to determine in any study as most questionnaires do not ask for ages of partners. Again, marketing efforts by cosmetic surgeons and future cosmetic surgery corporate outreach programs may be impacted by this data. While these data are of note and show trends in one cosmetic surgery practice, further evaluation and a larger, multisite, clinical survey might be of benefit to buttress or disprove these data.
The data on motivations for surgery were not statistically significant and therefore were not included in the paper. In the future, it may be possible to further refine questions to patients that will adequately reflect motivations.
The limitations of this study are that it was done in only one nonacademic practice, with a limited number of patients and in a single geographic location. Of 400 surveys, 64 were not returned (84% completion rate). In addition, since many of the questions asked could be considered personal (e.g., age, partnership status), patients may not have felt comfortable providing accurate answers, even though the respondents remained anonymous.
These data are meant to be a template for future studies regarding motivations, ages, and overall demographics of the cosmetic surgery population. It is hoped that a multicenter, geographically diverse study will be performed based on some of the data and concepts of this study.
Acknowledgment
The authors would like to thank Rachael Herman, patient coordinator at Skin Specialists, PC, for her invaluable assistance with the study. The statistics in this paper were compiled with assistance from ethica Clinical Research Inc. and Murray Jensen. Drs. Joel and Bernard Schlessinger would also like to thank Daniel Schlessinger for his principle contributions to the research and writing of this paper.
References
1. Cosmetic Surgery Demographics. http://www.surgery.com/ article/cosmetic-plastic-surgery-demographics-1. Updated May 26, 2009. Accessed on February 20, 2010.
2. CBS Interactive Business Network—American Demo-graphics. The price of beauty. http://findarticles.com/ p/articles/mi_m4021/is_6_25/ai_105777523/. Updated July 2003. Accessed on February 15, 2010.
3. American Society of Plastic Surgeons. 2009 Report of the 2008 statistics. http://www.plasticsurgery.org. Accessed on February 27, 2010.
4. Consumer Guide to Plastic Surgery. 2005 trend reports on cosmetic surgery in the United States. http://www.your plasticsurgeryguide.com/trends/charts-graphs-2005.htm. Updated March 2010. Accessed on April 12, 2010.
5. Jo M. New trends in cosmetic surgery. http://www.article snatch.com/Article/Upcoming-Trends-In-Cosmetic-Surgery/410661. Updated 2005. Accessed on March 23, 2010.
6. American Society for Plastic Surgeons. Cosmetic procedures up in all ethnic groups except Caucasians in 2008. http://www. plasticsurgery.org/Media/Press_Releases/Cosmetic_Procedures_Up_in_All_Ethnic_Groups_Except_Caucasians_in_2008.html. Published March 25, 2009. Accessed on April 10, 2010.
7. American Academy of Cosmetic Surgery. Cosmetic surgery: less common procedures less common than thought. http://www.cosmeticsurgery.org/media/pr_072909.pdf. Published July 29, 2009. Accessed on February 9, 2010.
8. Amercan Academy of Cosmetic Surgery. 2007 procedural survey reveals a two year increase in age of patients seeking cosmetic surgery. http://www.cosmeticsurgery.org/media/ pr_031308.pdf. Published March 13, 2008. Accessed on April 13, 2010.
9. Why cosmetic injection. Botox. http://www.whycosmetic injection.com/why-Botox.php. Updated 2008. Accessed on February 25, 2010.
10. Haussegger V. The age. US feminists championing Botox are betraying the cause. http://www.theage.com.au/opinion/ society-and-culture/us-feminists-championing-Botox-are-betraying-the-cause-20091214-kr11.html?comments=14. Published December 14, 2009. Accessed on March 20, 2010.
11. Sullivan DA. Cosmetic Surgery: The Cutting Edge of Commercial Medicine in America. New Brunswick, NJ: Rutgers Universtiy Press; 2001.
12. Facebook. Future trophy wives of America. http:// www.facebook.com/group.php?gid=2200650705. Updated 2010. Accessed on March 3, 2010.
13. Future Scopes. How to become a trophy wife. http://www.futurescopes.com/wealthy-dating/883/how-become-trophy-wife-marrying-someone-filthy-rich. Updated 2010. Accessed on February 26, 2010.
14. American Academcy of Cosmetic Surgery. American Academy of Cosmetic Surgery 2009 Procedural Census. http://www.cosmeticsurgery.org/media/2009_full_report.pdf. Published February 2010. Accessed on March 15, 2010.
15. U.S. Census Bureau. America’s families and living arrangements: 2008, Table A1. Marital status of people 15 years and over, by age, sex, personal earning, race, and Hispanic origin, 2008. http://www.census.gov/population/ www/socdemo/hh-fam/cps2008.html. Published January 2009. Accessed on April 11, 2010.
16. U.S. Census Bureau. Table 225. Educational attainment by race, Hispanic origin, and sex: 1970 to 2008. http://www. census.gov/compendia/statab/2010/tables/10s0225.pdf. Published 2010. Accessed on April 11, 2010.
17. American Society of Plastic Surgeons. Elective cosmetic surgery—examination of the patient experience. http://www. plasticsurgery.org/Documents/Media/Full-Survey.pdf. Published February 26, 2007. Accessed on March 24, 2010.
18. Bureau of Labor Statistics. Employment and Earnings: Vol. 56, No. 1. http://www.bls.gov/opub/ee/empearn200901.pdf. Published January 2009. Accessed on April 11, 2010.